Figures & data
Figure 1 Schematic representation of EAF conjugation of Alb with tempo.
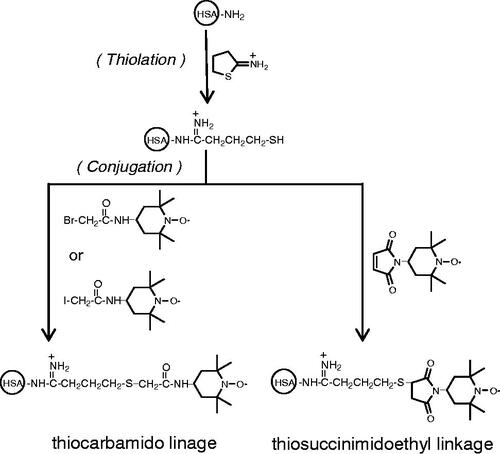
Figure 2 Experimental protocol to induce vaso-occlusion in NY1DD.
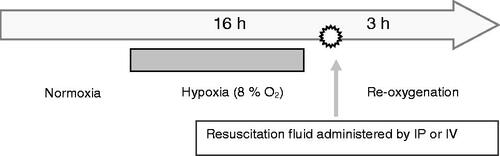
Table 1. Solution properties of semisynthetic active plasma expanders.
Figure 3 Representative images of venules from transgenic sickle cell mice (NY1DD) treated with Alb T12, EAF P5K6 Alb T12 and PEG Alb in hypoxia/reoyxgenation. (A) Wild type (B) NY1DD mice (C) NY1DD – untreated H/R (D) NY1DD mice treated with Alb T12 (E) NY1DD mice treated with EAF P5K6 Alb T12 (F) NY1DD mice treated with EAF P5K6 Alb T12.White arrow (→) indicate the blood flow direction and black arrow head indicates leukocytes.
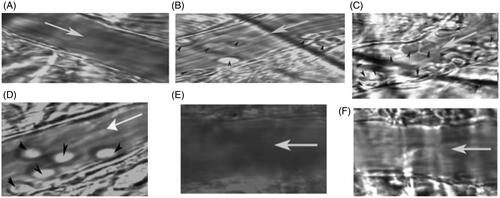
Figure 4 (A) NY1DD sickle mice receiving Alb T12, P5K6 Alb T12 and P5K6 Alb at the onset of reoxygenation showed marked reduction in leukocyte adhesion, with P5K6 Alb T12 having a normalizing effect. (B) NY1DD mice receiving P5K6 Alb and P5K6 Alb T12 at the onset of reoxygenation show marked reduction in leukocyte emigration compared with untreated NY1DD mice. *p< .03 vs. wild type; +p< .00001 vs. normoxic NY1DD mice; #p< .0001 vs. untreated NY1DD mice subjected to hypoxia-reoxygenation.
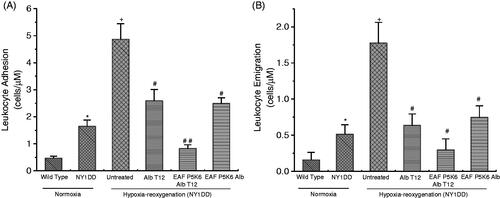
Table 2. The influence of PEG Alb and PEG Alb T12 on haemodynamic parameters of sickle (NY1DD) mice subjected active plasma expansion therapy using Hypoxia-Reoxygenation system.
Figure 5 Effect of Alb T12, P5K6 Alb T12, and P5K6 Alb on wall shear rate in transgenic sickle cell mice (NY1DD) and wild type (C57BL/6J). Values are mean ± SE. Four to six venules were examined for each mouse (n = 3–4 each experimental group); +p< .005–.0001 vs. normoxic wild type controls; **p< .05–.023 vs. respective normoxic values for NY1DD mice; #p< .004–.00001 vs. untreated NY1DD mice subjected to hypoxia-reoxygenation.
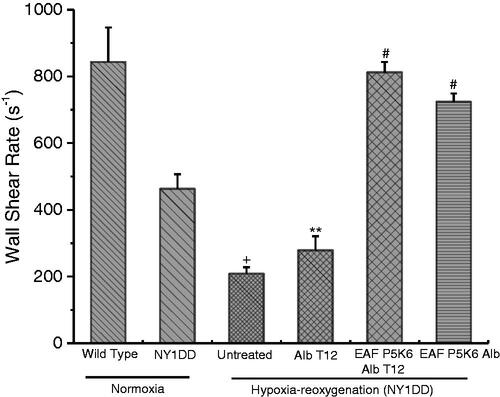
Figure 6 The intravital microscopic images of venules from transgenic sickle cell mice (NYIDD) subjected to hypoxia-reoxygenation protocol and treated with EAF P3K6 Hb after hypoxia.
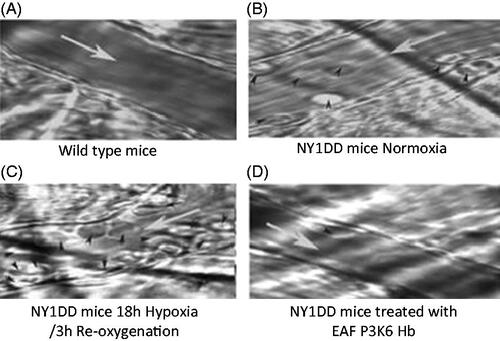
Figure 7 The response of cremaster arterioles (A3) to topical application of SNP (10−6 M) after pretreatment with 150 μL of 4 g% EAF P5K6 Alb T12.
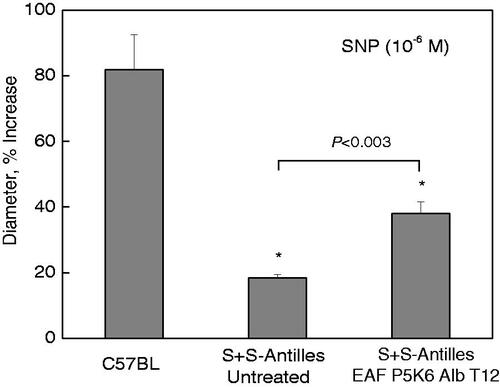
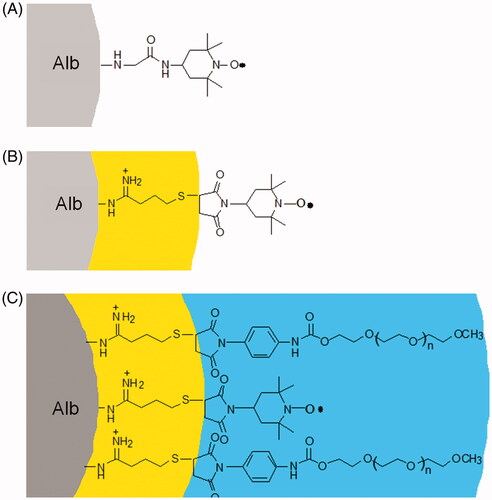
Figure 8 Exploded view of schematic representation of the structure of (A) Alb tempo, (B) EAF-Alb-tempo and (C) EAF PEG Alb-tempo.