Figures & data
Table 1. Clinical characteristics.
Figure 1. Microvascular Panel. Images were captured by a colour digital camera and adjusted for brightness and contrast to account for differential thicknesses in spinotrapezius muscles and minor shifts in focus. (A) Images were captured at baseline, immediately following ET and immediately after treatment. Each series is taken from a single site in an animal representative of its respective group. VOC is associated with a decrease in perfused vessels and a “blue shift” of larger vessels. Treatment with PEG-COHb but not LRS causes “red shift,” which is associated with a return of oxygenated haemoglobin to those blood vessels. (B) Each set of images is from a different experiment. The 5X image shows a VOC aggregate – denoted by purple arrow – that shifts position during treatment and then dissolves at the completion of treatment. The 40X image shows this effect in a smaller vessel where the aggregate can be seen undergoing a back-ended dissolution. Direction of flow is right to left in these images.
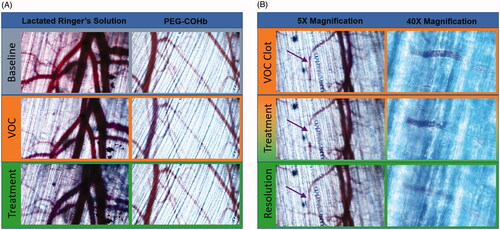
Figure 2. Tissue interstitial oxygenation. Tissue oxygenation was measured in the interstitial fluid bathing the capillary beds of the Distal, Medial and Proximal regions of the spinotrapezius muscle as the photograph diagrams. The Distal region was more sensitive to initial VOC aggregate formation and thus first developed local hypoxia. Other regions were not driven to hypoxia, but still showed reductions in PISFO2 following ET and responses to fluid treatment. PISFO2 was normalized to baseline for better visual comparisons and only intergroup differences are illustrated since tissues remained below baseline levels following ET. N = 8 per group. *p<.05, **p<.01, ***p<.001 and ****p<.0001.
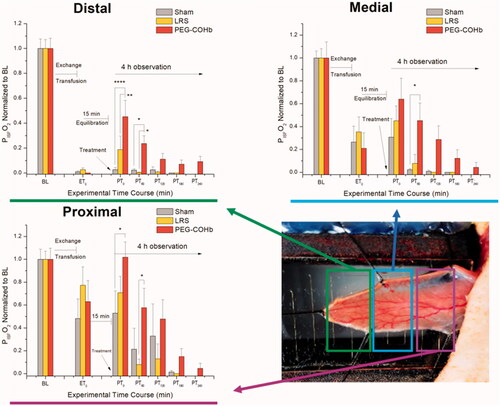
Table 2. Systemic variables.
Figure 3. Post-treatment survival. Study groups were assessed for duration of survival from the end of treatment. PEG-COHB showed a significant increase in survival versus LRS and Sham. *** Indicates p<.001 result from overall Log-rank Mantel–Cox test between both LRS and Sham versus PEG-COHB groups. N = 8 per group.
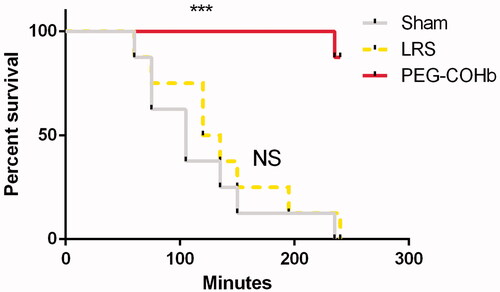
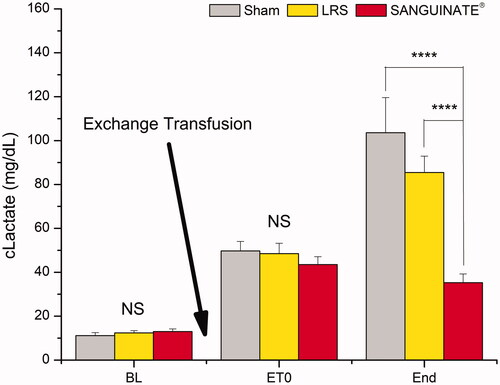
Figure 4. Lactate. Blood samples were collected at BL, ET0 and the experiment’s end (defined as 4 h post-treatment or a mean arterial pressure of <50 mmHg in demise animals) and assessed for serum lactate as an indicator of systemic metabolism. Induction of VOC produced a significant (not illustrated) increase in lactate across groups. Treatment produced a separation by the end of experiment with PEG-COHb showing no change versus ET0 (not illustrated). Intergroup comparisons are shown. N = 8 per group. ****p<.0001.