Figures & data
Figure 1. Preparation process of GO/NHs as a drug carrier.
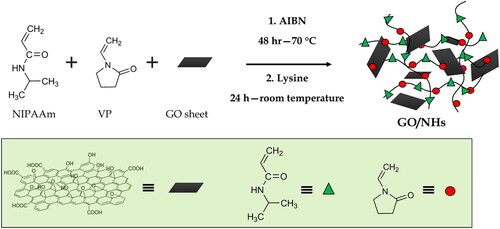
Figure 2. FTIR spectra GO (a), GO-NIPAAm-VP (b), and GO-NIPAAm-VP-lysine (GO/NHs) (c) at wavenumbers ranging from 1000 to 4000 cm−1.
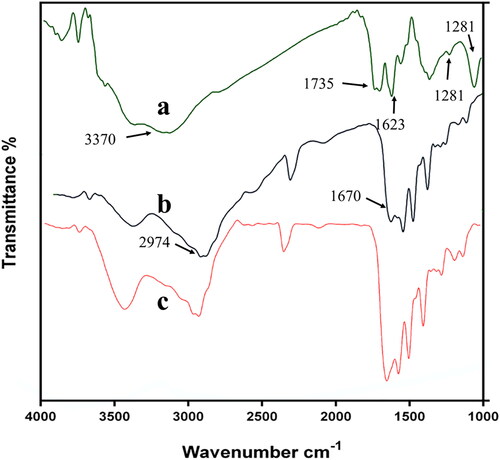
Figure 3. XRD diffraction patterns of GO and GO/NHs at room temperature.
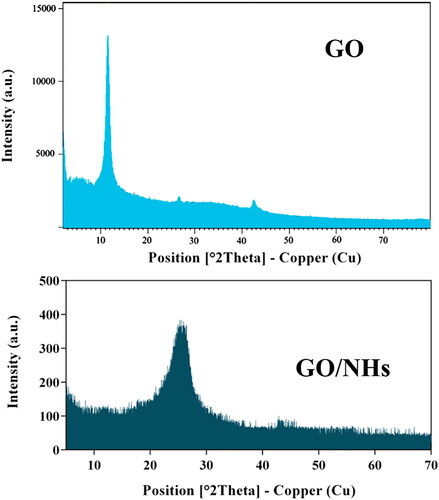
Figure 4. Thermal behaviour of GO/NHs by DSC analysis from 35 to 400 °C at a heating rate of 20 °C min−1 under a flowing nitrogen atmosphere.
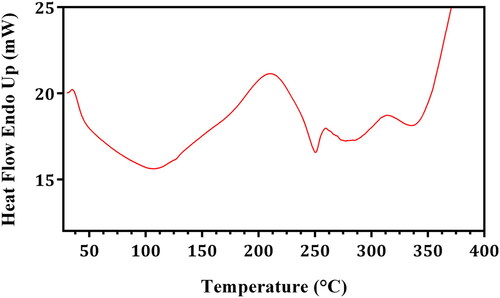
Figure 5. Particle size distribution of GO/NHs determining with DLS technique in PBS solution.
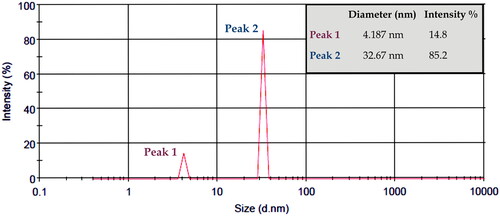
Figure 6. SEM images of the surface of GO 10 µm (a), 2 µm (b) and prepared GO/NHs 2 µm (c), and 500 nm (d).
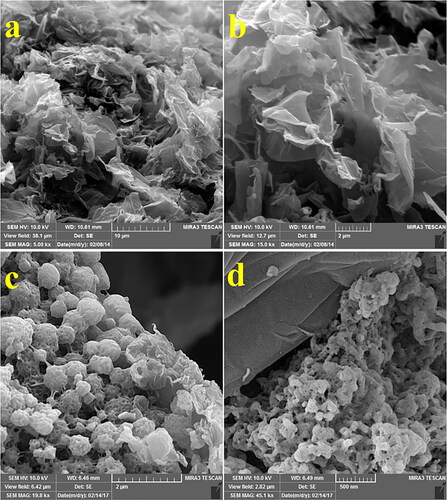
Figure 7. Selected area energy dispersion spectrum (EDS) analysis of GO/NHs as a semi-quantitative view of the elements.
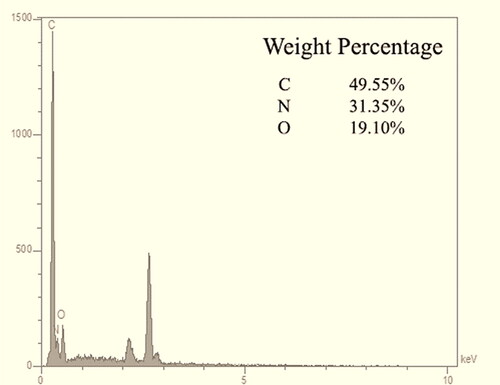
Figure 8. TEM images of GO (a) and GO/NHs (b).
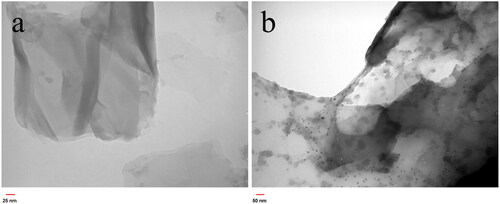
Figure 9. In-vitro drug release from FU-GO/NHs at different pH (5.5 and 7.4) and temperature values (37 and 40 °C) about four days.
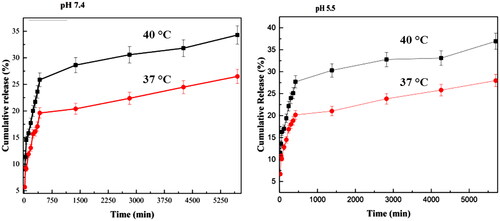
Figure 10. Haemolysis percentage (%) and optical images of human red blood cells treated with various concentration of prepared GO/NHs for 3 h.
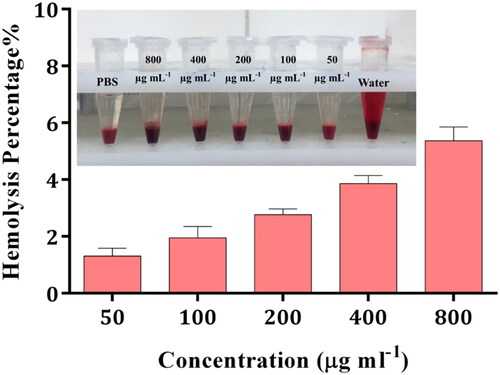
Figure 11. Cell viability of MCF7 after treatment with FU, FU-GO/NHs, and GO/NHs for 48 h.
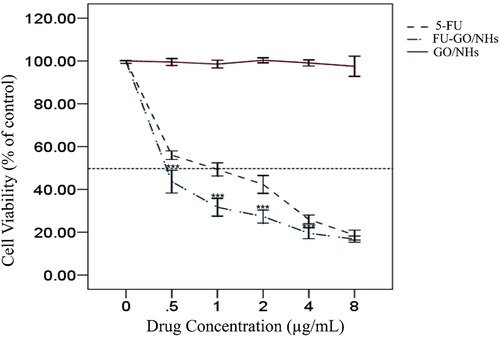
Figure 12. Cellular uptake images of MCF7 cells treated with Rho-labeled GO/NHs (rh-GO/NHs) for 1 (a) and 2 h (b).
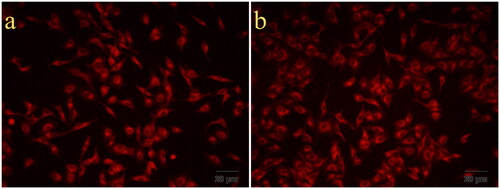
Figure 13. Cellular uptake graphs of MCF7 cells treated with Rho-labeled GO/NHs (rh-GO/NHs) for 1 (a) and 2 h subjected to flow-cytometry analysis using FACScalibur flow-cytometer.
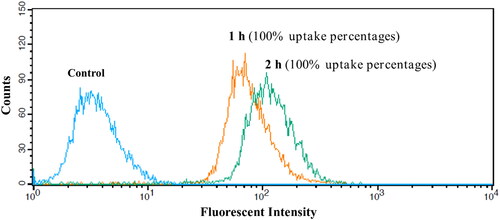
Figure 14. Representative photographs of MCF7 cells treated with GO/NHs (b), free FU (c), and FU-GO/NHs (d) for 48 h and stained with DAPI solution to monitor under fluorescent microscopy. The cells with no treatment considered as a control (a).
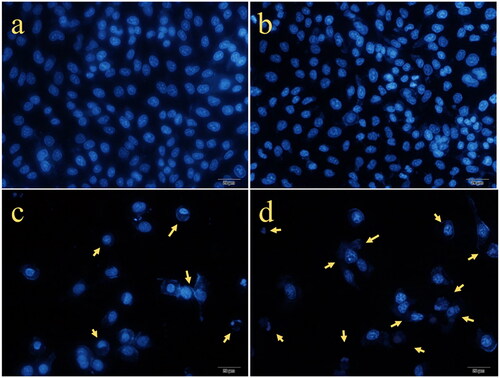
Figure 15. Protein expression levels of p53, PARP, and cleaved PARP after treatment with FU, FU-GO/NHs and GO/NHs for 48 h. β-actin was used as internal control. All experiments were done in triplicates and data were presented as mean ± SD.
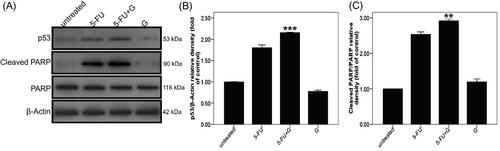
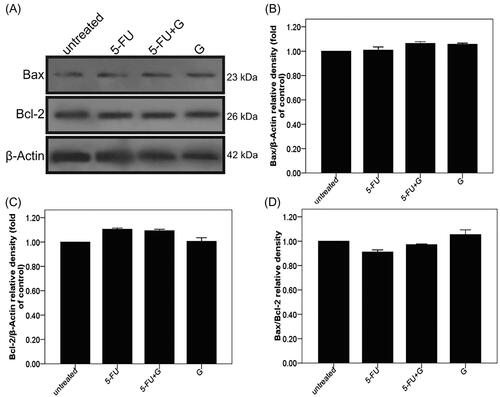
Figure 16. Protein expression levels of Bax and Bcl-2 after treatment with FU, FU-GO/NHs and GO/NHs for 48 h. β-actin was used as internal control. All experiments were done in triplicates and data were presented as mean ± SD.