Figures & data
Table 1. Characteristics of the primers used in the real-time polymerase chain reaction.
Figure 1 Schematic synthesis path of the conjugated biotin-PEG-PCL copolymer. And HNMR spectrum of biotin-PEG-PCL copolymer.
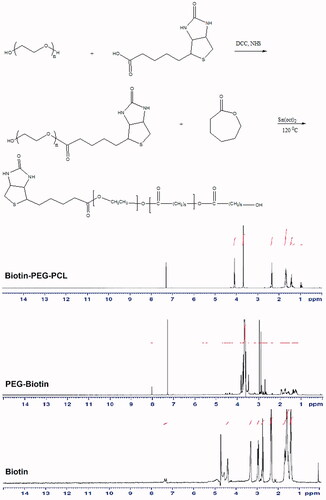
Figure 2 FT-IR spectrum of copolymers.
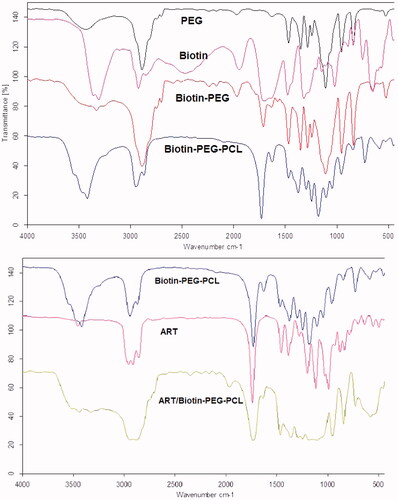
Figure 3 (a) DSC thermogram, (b) AFM image, (c) particle size distribution (d) and zeta potential of ART/Biotin-PEG-PCL micelles.
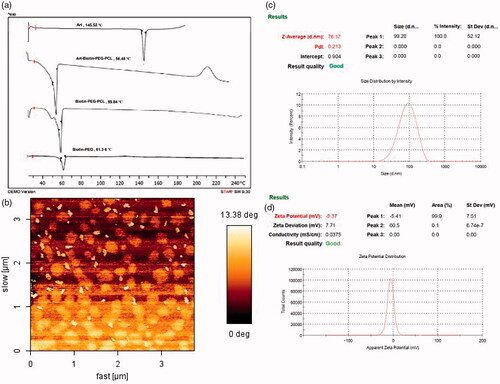
Figure 4 Physical stability of ART/biotin-PEG-PCL micelles z-average SD (n = 3), and the release profiles of ART from ART/biotin-PEG-PCL micelles in different release media (pH =7.4, plasma, pH =5.5).
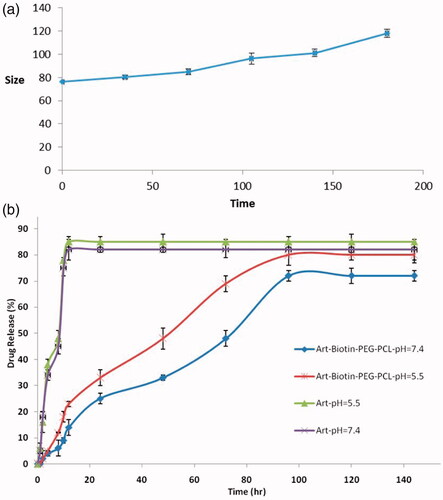
Figure 5 MTT assay of ART, polymer, and ART/biotin-PEG-PCL micelles (a) HFF-2 cell line after 48 h; (b) HFF-2 after 72 h; (c) MCF-7 after 48 h and (d) MCF-7 after 72-h incubation time period.
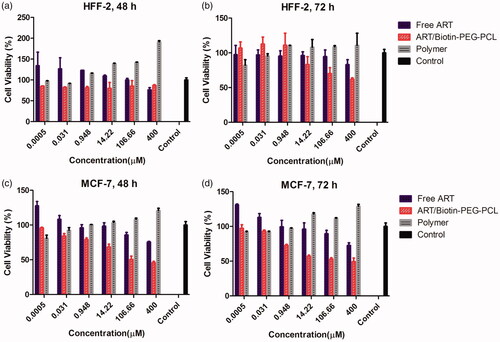
Figure 6 (a) Real-time quantitative PCR analysis, and (b) hemolysis percentages of RBCs in the presence of biotin-PEG-PCL and ART/biotin-PEG-PCL micelles at different concentrations (negative control: water – positive control: Saline). (c) Percent of weight change in mice after 48 h.
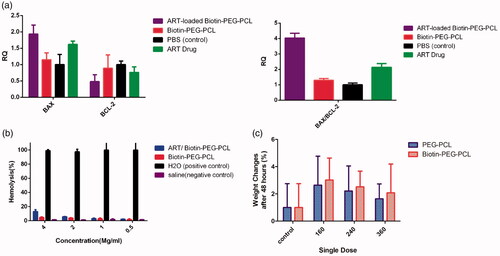
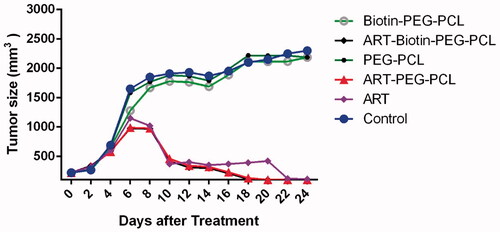
Figure 7 The evolution of tumour volume in mice after treatment.