Figures & data
Schematic illustration for the preparation of Bio-PA/EPI NPs using dialysis method and establishment of tumor model in vivo and in vitro.
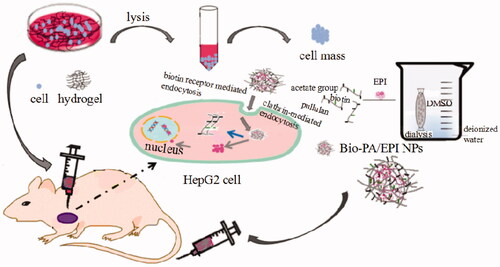
Figure 1. TEM images of Bio-PA NPs (a) and Bio-PA/EPI (b) prepared by dialysis method.
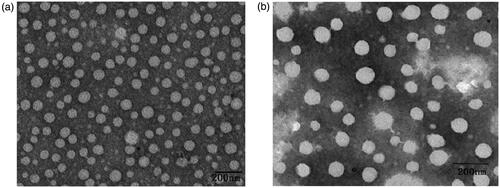
Figure 2. In vitro release profile of EPI from Bio-PA /EPI NPs.
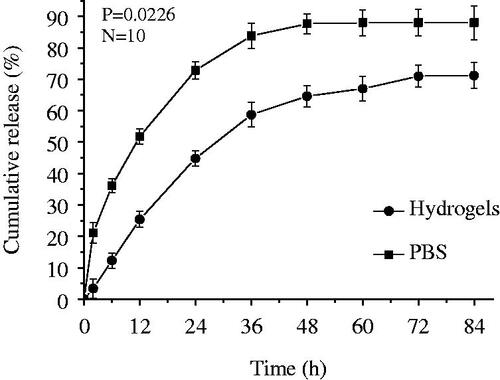
Figure 3. Growth curve of the 3D cultured HepG2 cells.
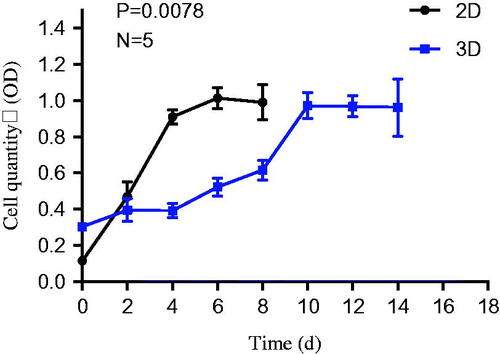
Figure 4. Morphological changes of HepG2 cells in defferent culture model: 2D (a), 3D (b) imaged by invert microscope. The balling rate (%) of two cell culture methods (c).
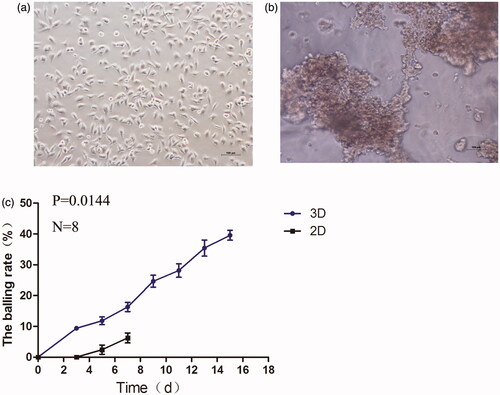
Figure 5. Confocal image of 2D in monolayer, 3D in spheroids and frozen section of tumor tissue (scale bar is 100 µm).
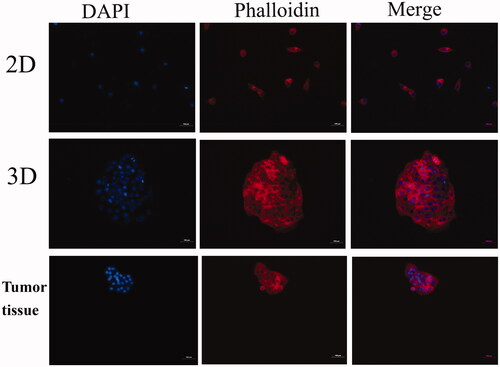
Figure 6. Cytotoxicity of Bio-PA NPs (a), EPI(b) and Bio-PA/EPI NPs (c) against HepG2 cells in 2D and 3D culture model.
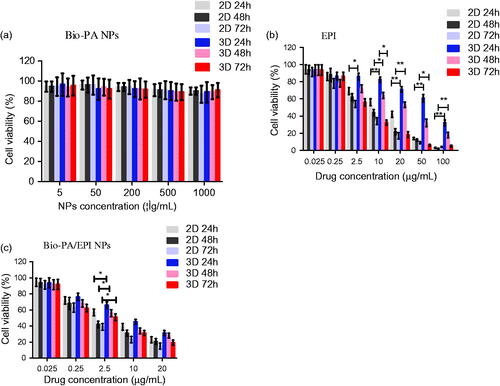
Table 1. IC50 of HepG2 Cells after 24, 48 and 72-h incubation with EPI, Bio-PA NPs at various drug concentrations in 2D and 3D culture method.
Figure 7. The changes of the tumor volumes in the tumor-bearing mice after 2D and 3D HepG2 cells subcutaneous injection (a). Average weights of different groups in the process of tumor growth (b). The picture of tumors/hydrogels removed from nude mice at specific time intervals after inoculated subcutaneously (c). Representative photomicrographs of the tumor sections (H&E staining) of mice of 2D and 3D (d).
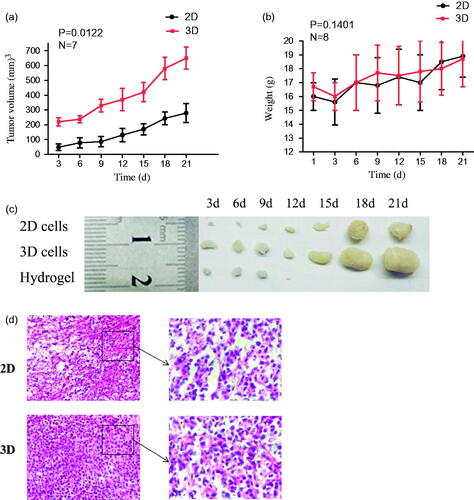
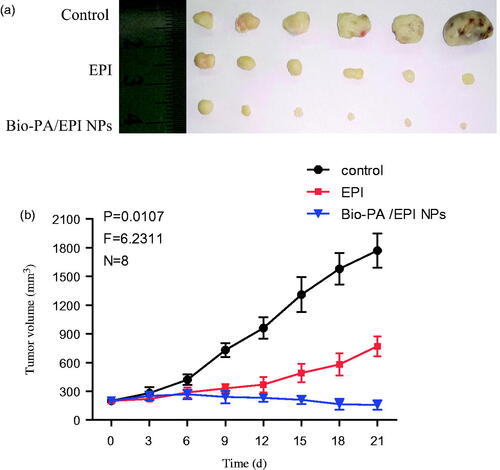
Figure 8. The picture of tumors removed from tumor-bearing nude mice at 21 days after the first injections (a). Tumor volumes in the tumor-bearing mice received three different treatments of saline, EPI and Bio-PA/EPI NPs (b).