Figures & data
Table 1. The Primer sequences included in this study.
Table 2. Correlation between LINC00858 expression and clinicopathological characteristics of CRC.
Figure 1. Expression levels of LINC00858 in CRC tissues and its clinical significance (A) Dysregulation of lncRNAs in CRC tissues compared with normal lung tissue was analyzed by using TCGA datasets. (B) The volcano plot showed the relationship between fold change and significance of lncRNAs expression. (C) Relative expression of LINC00858 in CRC tissues compared with normal tissue was analyzed by using TCGA data. (D) LINC00858 expression level in CRC tissues (n = 115) compared with corresponding non-tumour tissues (n = 115) was examined by qPCR and normalized to GAPDH expression. (E) LINC00858 expression was assessed by qRT-PCR analysis in CRC cell lines (HT-29, HT-15, SW837 and SW1463) and the normal colonic mucosa epithelial cell line (FHC). (F) Kaplan–Meier overall survival curves according to LINC00858 expression level. * p < 0.05, **p < .01.
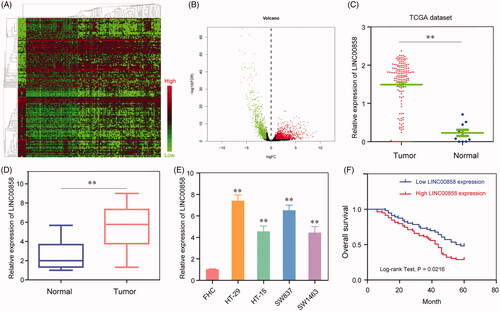
Table 3. Univariate and multivariate analyses for overall survival by cox regression model.
Figure 2. The effects of LINC00858 on the proliferation, colony formation and apoptosis of HT-29 and SW837 cells. (A) Relative expression levels of LINC00858 in HT-29 and SW837 cells after transfecting with LINC00858 siRNAs. (B) CCK-8 assays were performed to evaluate the proliferation of HT-29 and SW837 cells. (C) Representative images of the colony formation assays and statistical analysis of cell colony numbers. (D and E) Flow cytometry analysis detected the apoptosis of HT-29 and SW837 cells transfected with LINC00858 siRNAs. *p < .05, **p < .01.
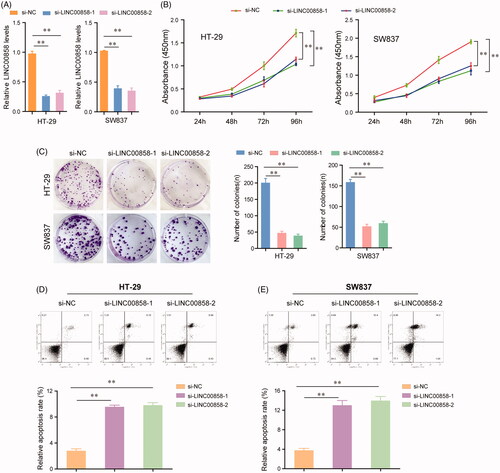
Figure 3. The effects of LINC00858 on the migration and invasion of HT-29 and SW837 cells. (A) The wound-healing assays showed that transfection of LINC00858 siRNAs reduced the migratory abilities of HT-29 and SW837 cells. (B and C) The invasive cell numbers of HT-29 and SW837 cells transfected with LINC00858 siRNAs were significantly decreased using transwell invasion assays. (D and E) N-cadherin and vimentin in HT-29 and SW837 were detected by western blot assays. * p < .05, **p < .01.
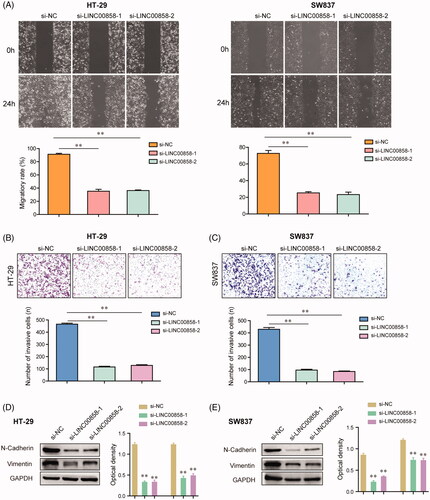
Figure 4. MiR-22-3p was a direct target of LINC00858. (A) Binding region between miR-22-3p and LINC00858 which was predicted by “starBase V2.0”. (B) Dual luciferase reporter assays showed that LINC00858 directly targeting miR-22-3p. (C) RIP assay determined the enrichment of LINC00858 and miR-22-3p. (D and E) The expression levels of miR-22-3p in CRC tissues and cell lines were evaluated by qRT-PCR assays. (F) The expression levels of miR-22-3p in HT-29 and SW837 cells after transfecting pcDNA3.1-LINC00858 overexpressing plasmid or LINC00858 siRNAs. (G) Pearson’s correlation analysis was applied to analyse the expressing relationship between LINC00858 and miR-22-3p. *p < .05, **p < .01.
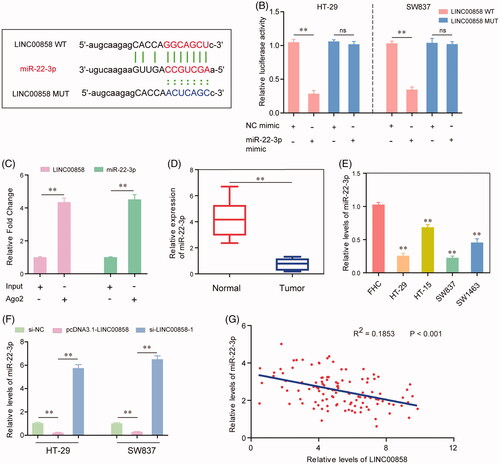
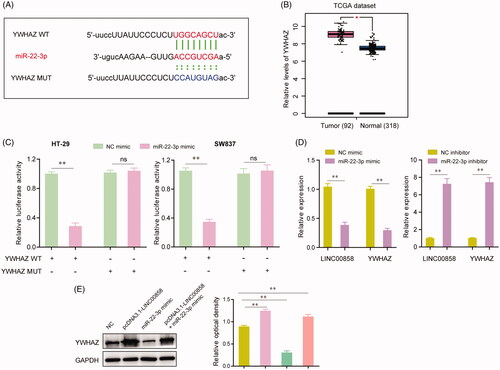
Figure 5. YWHAZ was a target gene of miR-22-3p. (A) The putative binding sites of miR-22-3p within the 3′-UTR of YWHAZ as predicted by “starBase V2.0”. (B) The relative expression of YWHAZ were analysed by “GEPIA” using TCGA dataset. (C) Dual-luciferase reporter assays showed the luciferase activities of the combination of miR-22-3p and YWHAZ wild-type (WT) or mutant (MUT). (D) The relative expression levels of LINC00858 or YWHAZ in HT-29 cells after transfecting with miR-22-3p mimic or inhibitor. (E) The protein levels of YWHAZ in HT-29 cells after transfection of pcDNA3.1-LINC00858, or miR-22-3p mimic, or co-transfection of pcDNA3.1-LINC00858 as well as miR-22-3p mimic. *p <.05, **p < .01.