Figures & data
Table 1. The zeta potential of NPs.
Figure 1 Cell growth characteristics of Mo59K (light grey) and U-87 MG (dark grey) cells were determined over 4 days. Each sample was replicated (n = 20). Data shows the mean ± standard deviation.
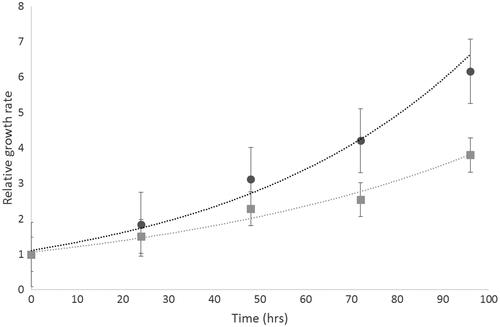
Figure 2 Viable cell count after incubation with nanoparticles, and subsequent irradiation with either 0 Gy or 3 Gy. Cells were counted using a hemocytometer 72 and 24 h after irradiation for (A) Mo59K, or (B) U-87 MG cells, respectively. Results are expressed relative to either the O Gy or 3 Gy cell only control, as appropriate. Data shows the average ± standard deviation of three independent experiments, each perfomed in triplicate. Statistical data was assessed by Student t-test, and significance is shown as * p < .05, ** p < .01, *** p < .005 when compared to the relevant cell only control.
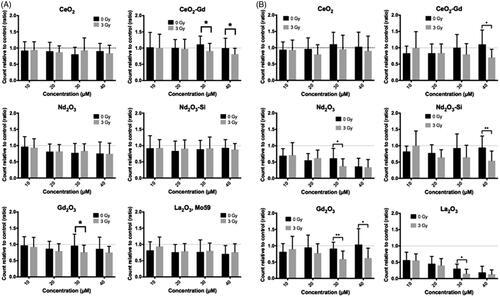
Table 2. The relative radiosensitivity of a small number of immortalized cancer cell lines for comparison against Mo59K and U-87 MG.
Figure 3 Clonogenic Assay. Rare earth elements were incubated with either (A) Mo59K, (B) U-87 MG cells. Cells were incubated with nanoparticles, and irradiated with either 0 Gy or 3 Gy. Cells were then plated and colonies counted. Technical replicates were performed in at least triplicates, experimental repeats were performed in triplicate. Data shows the average ± standard deviation. Statistical data was assessed by student t-test and is shown as * p < .05, ** p < .01, *** p < .005 when compared to the relevant cell only control.
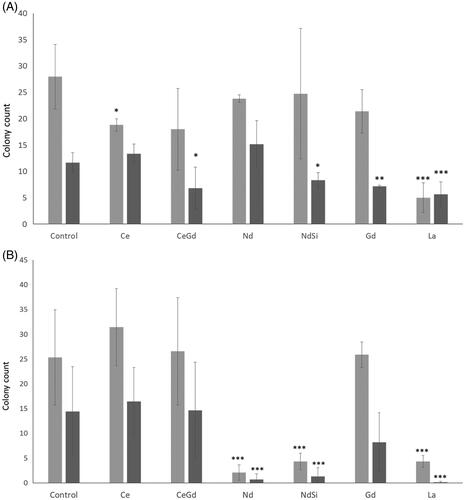
Figure 4 Cell fluorescence marker indicating ROS in U-87 MG cells. Adherent cells were incubated with a variety of Rare Earth nanoparticles at a concentration of 40 μM for 24 h. The cells were then exposed to either 0 Gy (no radiation) or 3 Gy irradiation. After a further 1 h fluorescence was assessed with an inverted microscope (Optimal Ex. 465; Em. 510 nm) using a 4 s exposure to record images. Brighter fluorescence indicates greater ROS production. Representative images are shown from n = 3 sample repeats, and n = 2 independent experiments.
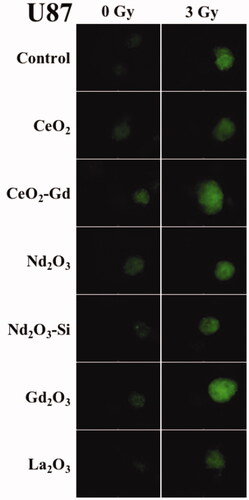
Figure 5 Scratch test. Confluent adherent cell layers were scratched to produce a gap. Nanoparticles were added to the incubation media. Cells were then either exposed to 0 Gy or 3 Gy irradiation. Microscopic images were taken at time zero, and after regrowth, and the gap closure calculated. (A) Mo59K cells (B) U-87 MG cells. Statistical data is shown as * p < .05, ** p < .01, *** p < .005 when compared to the relevant cell only control. Data shows the average ± standard deviation of triplicate repeats, two independent experiments.
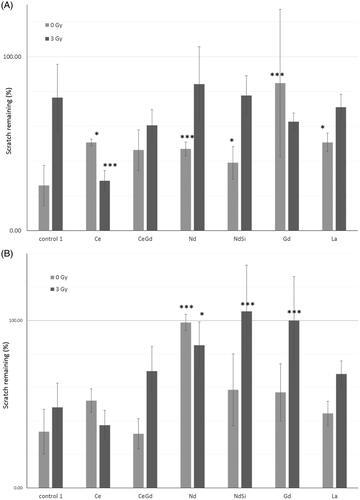
Figure 6 Autophagy assay. Rare earth elements were incubated with either Mo59K cells (light grey bars) or U-87 MG cells (dark grey bars). Cells were incubated with 40 μM nanoparticles for 16 h, and irradiated with either 0 Gy or 3 Gy. Cells were then plated and colonies counted. Data shows the average ± standard deviation, of triplicate experiments. Statistical data is shown as * p < .05, ** p < .01, *** p < .005.
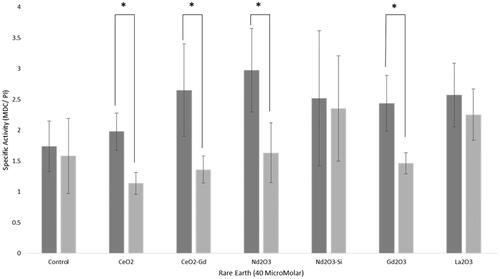
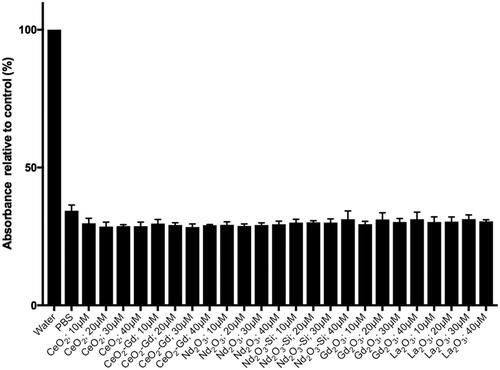
Figure 7 Haemotoxicity assay. Red blood cells were prepared and incubated with either water, PBS or nanoparticles in PBS. Rare earth nanoparticles were tested at concentrations of 10, 20, 30 and 40 μM concentrations.