
Figures & data
Figure 1 DSC thermogram of (a) AM (b) GMS (c) physical mixture of AM and GMS (d) lyophilized AM-SLNs.
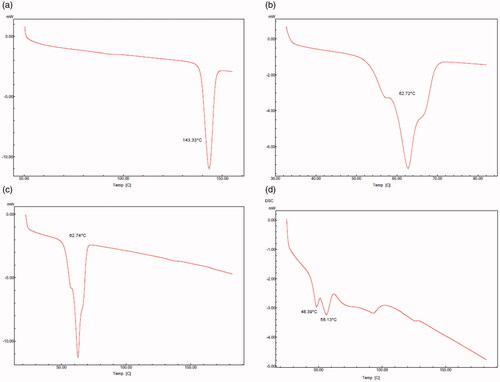
Figure 2 XRD of (a) AM (b) GMS (c) physical mixture of AM and GMS (d) lyophilized AM-SLNs.
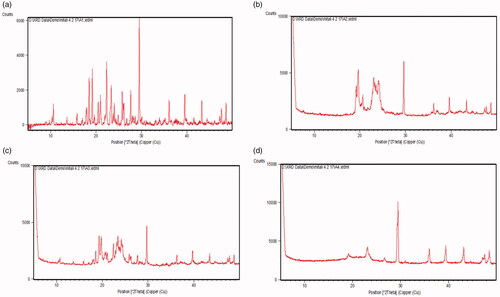
Figure 3 TEM image of optimized batch of AM-SLNs.
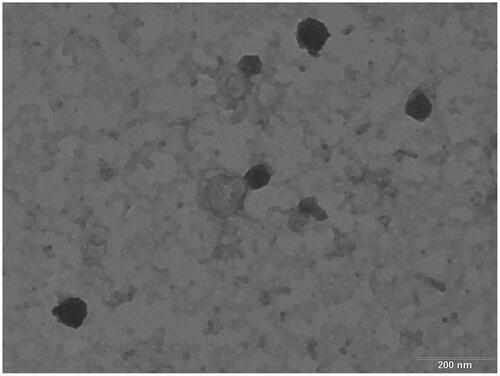
Figure 4 In vitro drug release profile of AM-SLNs and drug dispersion (n = 3). *p < .05 compared to drug dispersion.
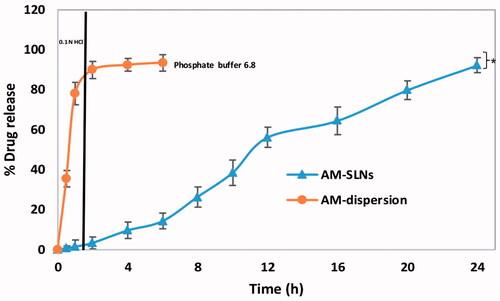
Figure 5 Cell viability assay of the AM-SLNs in Caco-2 cell line (n = 3). *p < .05 compared to drug dispersion.
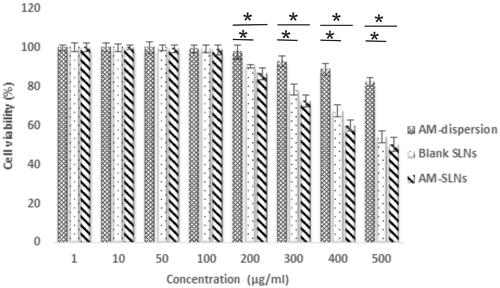
Figure 6 Cellular uptake of (a) coumarin-6 solution, (b) coumarin-6 loaded SLNs across Caco-2 cells using confocal microscopy at different time intervals.
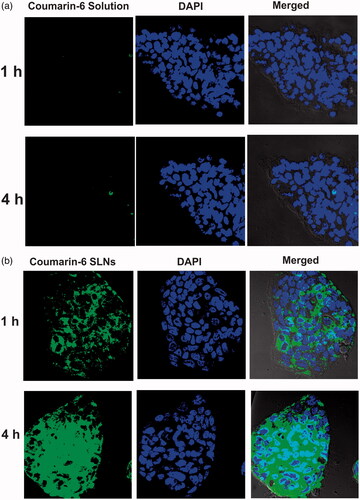
Figure 7 Histogram showing uptake of coumarin-6 solution, coumarin-6 loaded SLNs at different time points across Caco-2 cells.
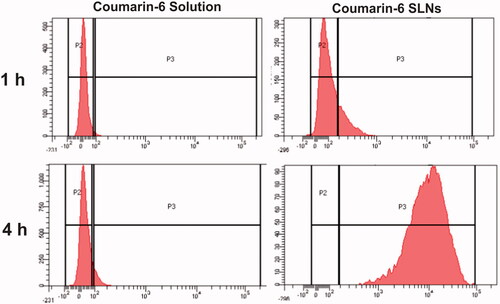
Figure 8 Intracellular uptake of SLNs and drug dispersion in presence of specific inhibitors. *p < .05 compared to control group.
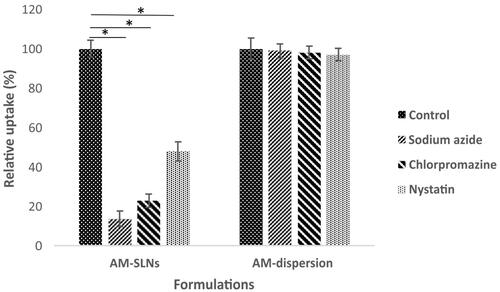
Figure 9 Plasma concentration versus time profile after oral administration of AM-SLNs and AM dispersion (n = 6). *p < .05 compared to drug dispersion.
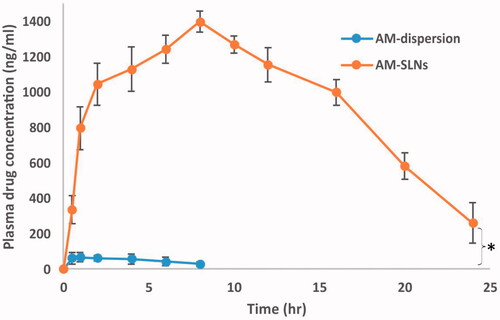
Table 1. Pharmacokinetic parameters of AM-SLNs and AM dispersion after oral administration.
Figure 10 Plasma concentration versus time profile after oral administration of AM-SLNs to cycloheximide treated and non-treated (control) rats (n = 6). *p < .05 compared to control group.
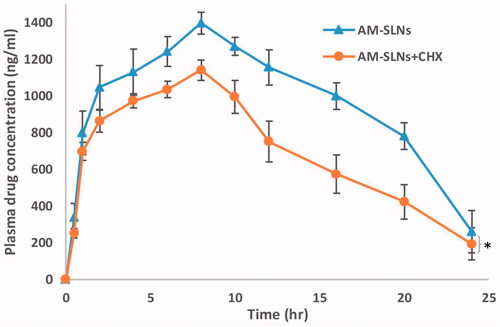
Table 2. Characteristics of AM-SLNs after 3-months stability studies at different conditions.