Figures & data
Figure 1. SEM characterization of MAO (a–c) and MHTZn (d–f) morphology.
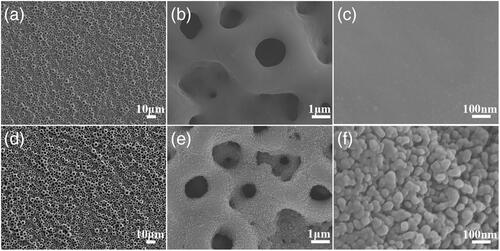
Figure 2. Contact angles of MAO and MHTZn coatings. Values represent mean ± SD (n = 3). * depicts statistical differences. **p < .01.
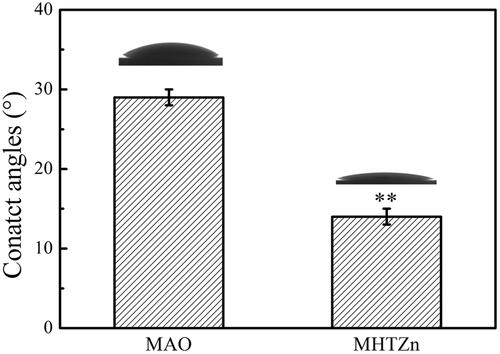
Figure 3. Fibronectin adsorption of MAO (a) and MHTZn (b) groups and quantitative analysis (c). Values represent mean ± SD (n = 3). * depicts statistical differences. **p < .01.
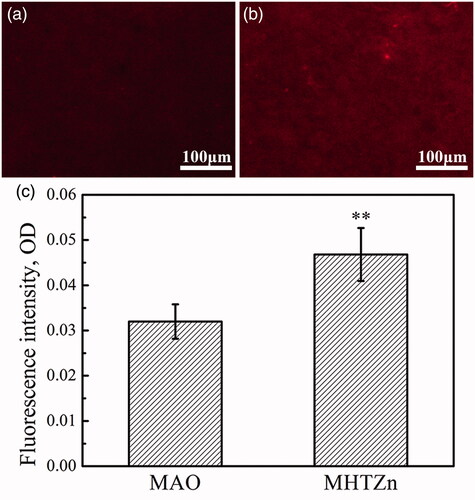
Figure 4. Cytoskeletal and nuclear staining (a) and quantitative analysis (b) of SaOS-2 cells attached to MAO and MHTZn coatings at 4 and 24 h. Values represent mean ± SD (n = 3).
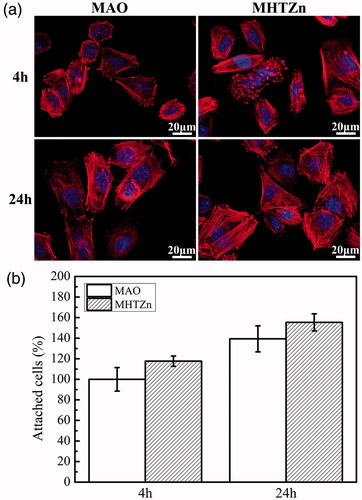
Figure 5. Morphologies of attached cells on the MAO at 4 h (a) and insert, 24 h (c) and insert; MHTZn at 4 h (b) and insert, 24 h (d) and insert.
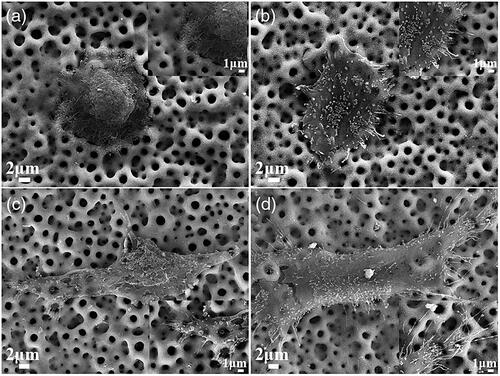
Figure 6. ALP activity (a) and collagen secretion (b) of SaOS-2 cells cultured on MAO and MHTZn samples for 7 days. Values represent mean ± SD (n = 3). * depicts statistical differences. **p < .01.
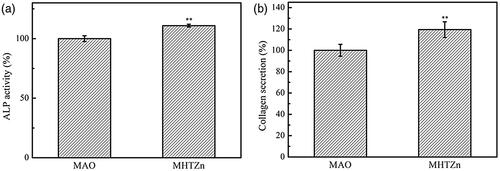
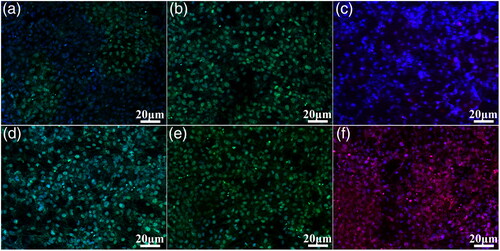
Figure 7. Immunofluorescence detection of SaOS-2 cells grow on the MAO coating: OPN (a), Col-I (b), and OCN (c); and the MHTZn coating: OPN (d), Col-I (e), and OCN (f) for 14 days.