
Figures & data
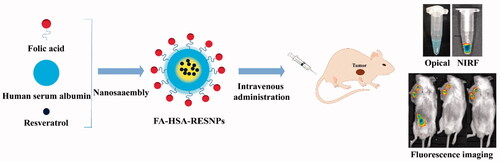
Figure 1 Synthesis of RES NPs encapsulated by FA-coupled HSA.
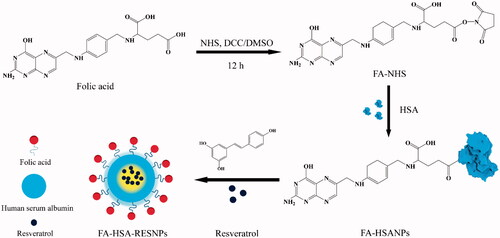
Table 1. Relationships between the parameters and particle size when one variable parameter and others are fixed.
Figure 2 Optimal emulsified state observed by optical microscopy: (A) 10 × 40 and (B) 10 × 100 magnification.
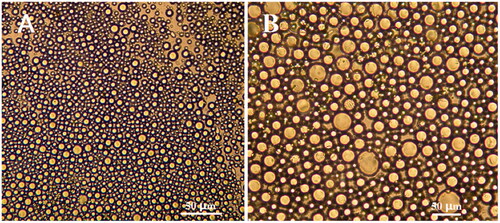
Table 2. Influence of particle size on homogenization times and pressure.
Figure 3 Morphology of samples observed by SEM and TEM: (A) raw RES, (B) HSA, (C) FA-HSANPs, (D) FA-HSA-RESNPs, (E) single NP and (F) photograph of freeze-dried FA-HSA-RESNP powder (left) and aqueous dispersion (right).
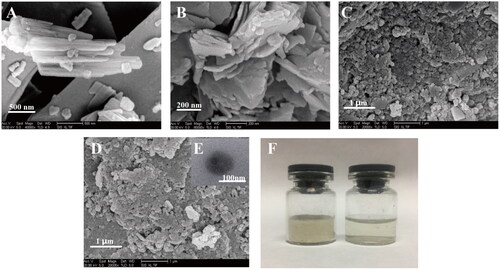
Figure 4 (A) Infrared spectrograms of (a) FA, (b) HSA, (c) FA-HSANPs, (d) raw RES and (e) FA-HSA-RESNPs. (B) XRD patterns of (a) raw RES, (b) HSA, (c) FA-HSANPs and (d) FA-HSA-RESNPs. (C) DSC thermograms of (a) raw RES, (b) HSA, (c) FA-HSANPs and (d) FA-HSA-RESNPs. (D) TGA thermograms of (a) FA-HSANPs, (b) FA-HSA-RESNPs, (c) HSA and (d) raw RES.
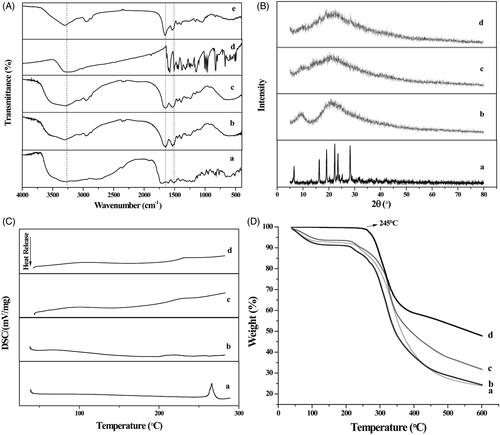
Figure 5 Drug-release curves (a) raw RES and (b) FA-HSA-RESNPs.
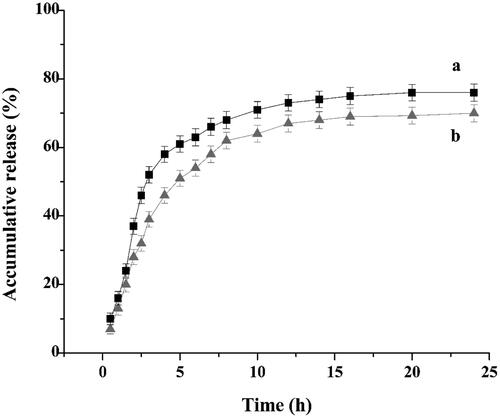
Figure 6 Inhibitory rates of HepG2 cells by raw RES and FA-HSA-RESNPs.
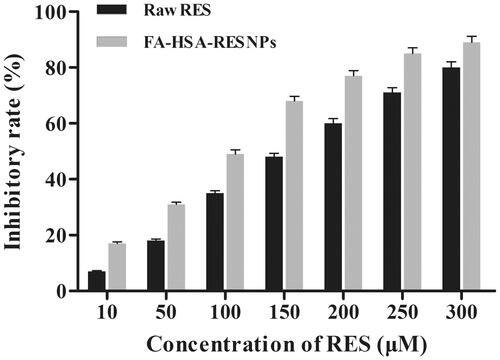
Figure 7 LSCM images of (A) FITC-labeled FA-HSA-RESNPs, (B) FITC-labeled FA-HSANPs, (C) FITC-labeled physical mixture of FA-HSANPs, (D) FITC-labeled raw RES, (E) blank cells without NPs added, (F) fluorescence intensity of NP uptake by cultured HepG2 cells and (G) concentration dependence of FA-HSA-RESNP uptake by cultured HepG2 cells. Notes: ***p ≤ .001. Abbreviation: CK, control check.
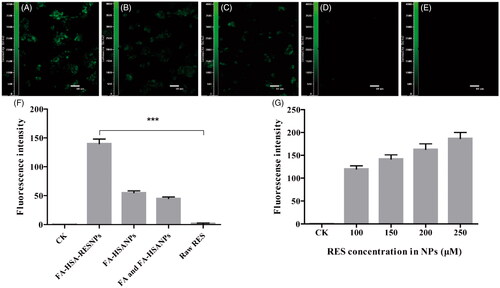
Figure 8 In vivo imaging, NIRF images of Cy5-labeled FA-HSA-RESNPs: (a) white light and NIRF images of Cy5-labeled FA-HSA-RESNPs, (b) bioluminescence imaging of blank control mice, (c) bioluminescence imaging of H22 tumor-bearing KM mice injected with HSA-RESNPs and (d) bioluminescence imaging of H22 tumor-bearing KM mice injected with FA-HSA-RESNPs. HSA-RESNPs: HSA wrapping RES NPs. FA-HSA-RESNPs: FA-conjugated HSA NPs wrapping RES NPs.
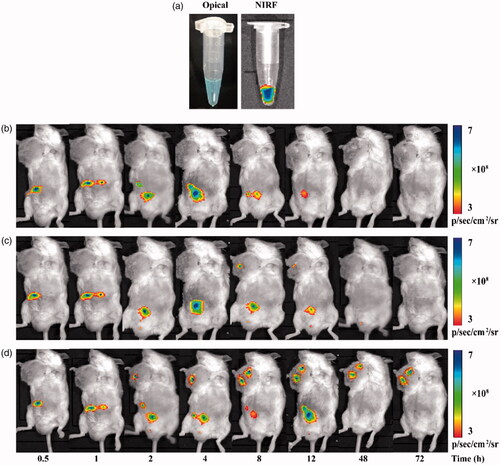
Figure 9 Plasma concentration of FA-HSA-RESNPs and raw RES.
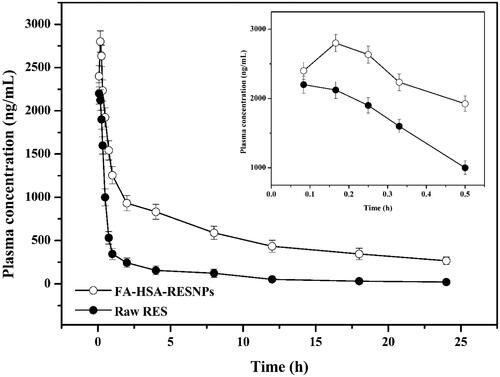
Table 3. Effects of FA-HSA-RESNPs on the indices of rat immune organs.