Figures & data
Scheme 1 (a) PLGA-PEG-PLGA copolymer was dissolved into DOX liposomes suspension to form DOX-Lip-Gel, which was in a sol state at 25 °C. (b) DOX-Lip-Gel solution was injected peritumorally and transformed into a solid gel in situ at body temperature (37 °C), enabling the sustained release of DOX and significant inhibition of tumour growth.
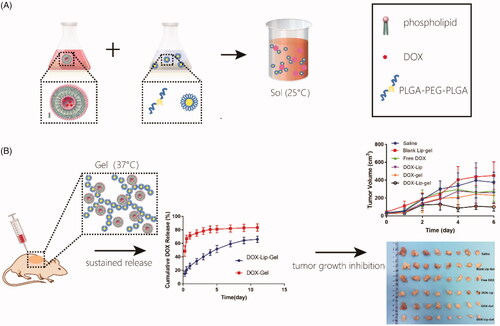
Figure 1 1H NMR spectra of PLGA-PEG-PLGA copolymer.
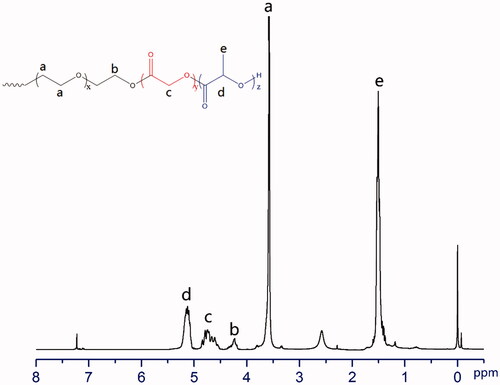
Table 1. Chemical structure and chemical shift of PLGA-PEG-PLGA determined 1H NMR.
Table 2. Molecular parameters of the synthesized copolymer.
Figure 2 FT-IR spectrum of PLGA-PEG-PLGA copolymer.
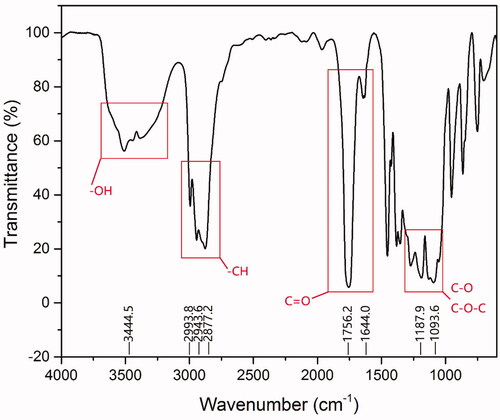
Figure 3 Particle size distribution of blank gel and blank Lip-Gel at different temperatures. The polymer concentration was 20 wt%.
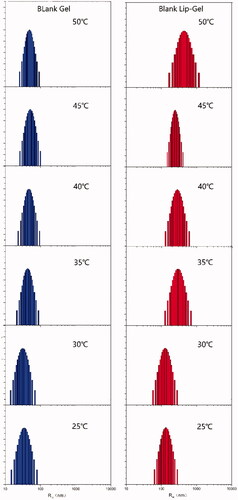
Figure 4 Viscosity analysis of blank gel (a) and DOX-Lip-Gel (b) with respect to temperature. The gel concentration was 20 wt%.
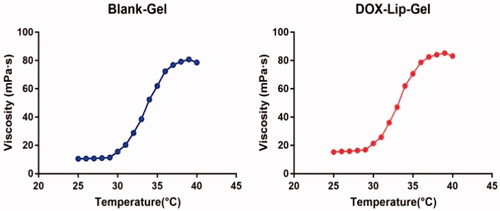
Figure 5 Blank Lip-Gel (a) and DOX-Lip-Gel (b) were in a sol state at room temperature (25 °C) and transformed into the solid gel at 37 °C.
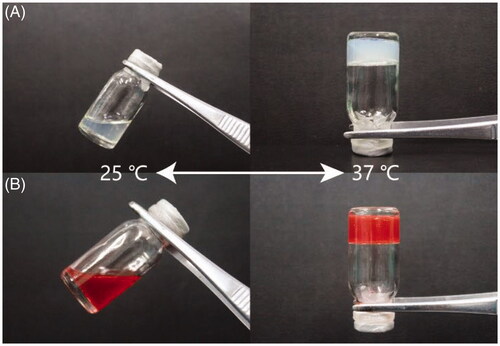
Figure 6 The degradation behaviour of the PLGA-PEG-PLGA based thermogel. The polymer solution (20 wt%) formed a gel in situ on Day 0 and degraded gradually with time.
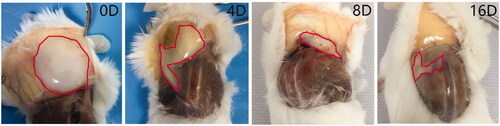
Figure 7 HE-stained images of skin tissue after subcutaneous injection of thermogel (20 wt%) at predetermined time points. S: skin tissue; G: thermogel. The scale bar is 200 μm.
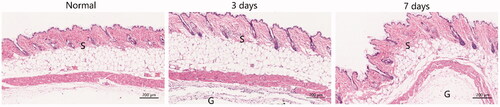
Figure 8 In vitro cumulative DOX release profile from DOX-Gel, and DOX-Lip-Gel in PBS 7.4 solution at 37 °C. The experiment was done according to the tube method (n = 3).
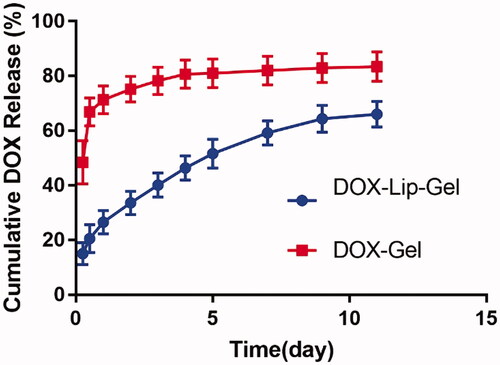
Figure 9 In vivo antitumor efficiency of different groups of saline, blank Lip-Gel, Free DOX, DOX-Lip, DOX-Gel and DOX-Lip-Gel on orthotopic tumor-bearing BABL/c mice model *p < 0.05, **p < 0.01, n = 6. (A) schematic of the time course of drug administration within the cycle of treatment; (B) tumor volume curves; (C) tumor weight of the different groups; (D) typical tumor images of all groups on Day 13; (E) body weight of different groups during the whole therapy.
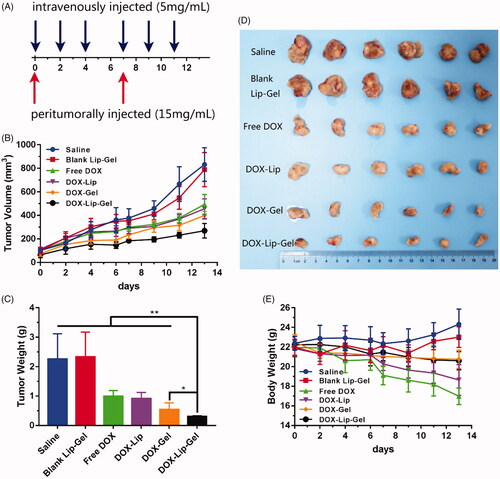
Table 3. Tumour inhibition parameters (n = 6).
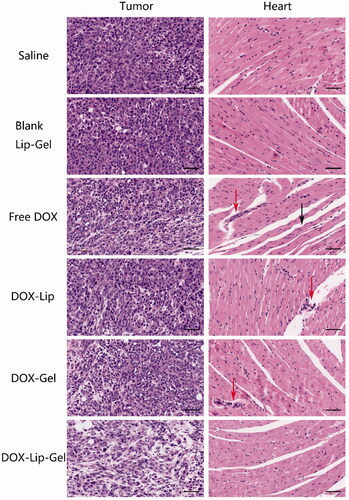
Figure 10 (a) HE-stained images of tumour cross-sections of breast tumour-bearing BALB/c female mice taken on the Day 13 after administration of saline, blank Lip-Gel, free DOX, DOX-Lip, DOX-Gel, and DOX-Lip-Gel. (b) HE-stained images of heart tissue obtained after treated with saline, blank Lip-Gel, free DOX, DOX-Lip, DOX-Gel and DOX-Lip-Gel. Some typical inflammatory cells were denoted by red arrows, disorganization of myofibrillar arrays was denoted by blank arrows. The scale bar is 50 μm.