Figures & data
Figure 1. PATRC characterization. (A) The nanometer of PATRC was tested by the size analyzer of dynamic light scattering (DLS); (B) The solution of PATRC was added onto the copper wire, and the morphology characterization was observed through dying with uranyl acetate for transmission electron microscopy (TEM).
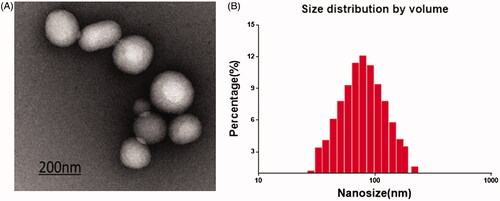
Figure 2. The RBE4 cell targeting of PATRC was detected by immunofluorescence. (A) RBE4 incubated with TP (10 μg/ml); (B) RBE4 incubated with PATRC (containing 10 μg/ml TP); (C) RBE4 incubated with iTP (10 μg/ml). Images were observed under a 20-fold objective lens. RBE4 targeting of PATRC was detected by flow cytometry method. (D,1) RBE4 cells incubated with PBS; (D,2) RBE4 incubated with iTP (10 μg/ml); (D,3) RBE4 incubated with PATRC (containing 10 μg/ml TP); (D,4) RBE4 incubated with TP (10 μg/ml).
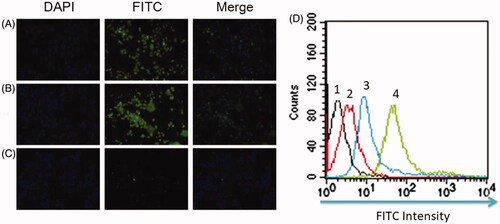
Figure 3. A flow cytometry was used to detect RBE4 apoptosis induced by hypoxia. RBE4 cells were divided into (A) PBS treatment group (10 μl PBS, control group); (B) hypoxia induction (1 mmol/L Na2S2O4, HI group); (C) hypoxia induction plus Rg1 treatment (1 mmol/L Na2S2O4 and 10 μM Rg1, HI + Rg1 group); (D) hypoxia induction plus PATRC treatment (1 mmol/L Na2S2O4 and 10 μM Rg1, HI + PATRC group).
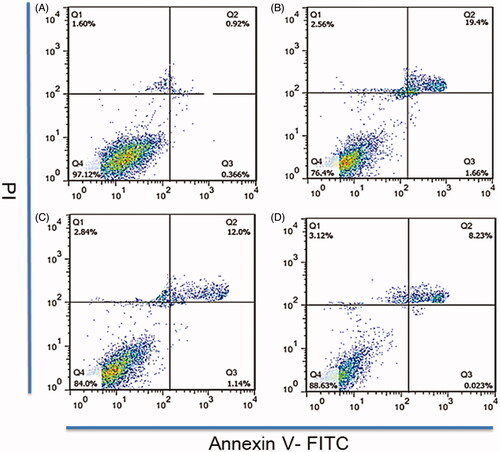
Figure 4. The RBE4 tube production in vitro. RBE4 cells were treated with matrigel for tube formation. (A) PBS treatment (10 μl PBS, control group); (B) under hypoxia condition, (1 mmol/L Na2S2O4, HI group); (C) under hypoxia condition, treated with Rg1 (1 mmol/L Na2S2O4 and 10 μM Rg1, HI + Rg1 group); (D) under hypoxia condition, treated with PATRC (containing 1 mmol/L Na2S2O4 and 10 μM Rg1, HI + PATRC group). After 8 h of incubation, then observed under a 4-fold objective lens; E. relative tube amount of RBE4. *p < .05, **p < .01.
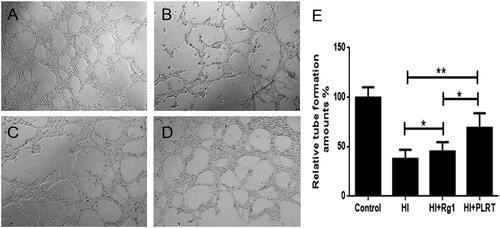
Table1. BBB penetrating ability of PATRC in vivo.
Figure 5. TTC staining of brain tissues. Brains tissues were cut into 2 mm thick slides then immersed in 1% TTC at 37 °C for 30 min. The pale regions were infarction tissues and the red regions were normal tissues. (A) Control group, normal rats treated with PBS; (B) model group, cerebral infarction model group treated with PBS; (C) Rg1 group, cerebral infarction model group treated with Rg1 (50 μmol/kg); (D) PATRC group, cerebral infarction model group treated with PATRC (containing 50 μmol/kg Rg1); E. Cerebral infarction volume of different groups.*p < .05,**p < .01.
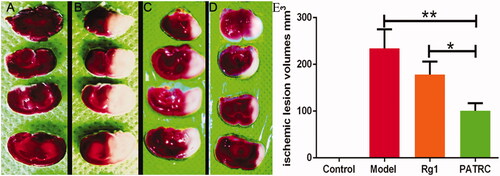
Table 2. Cerebral infarct volume of different groups detected by TTC staining.
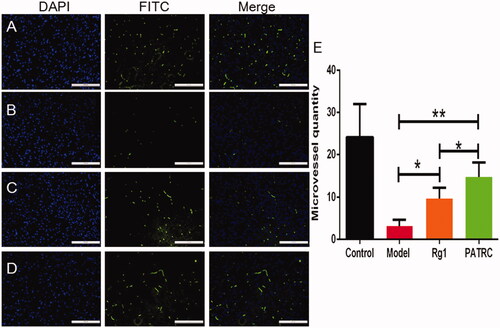
Figure 6. The capillary of infarction tissue detected with immunofluorescence. Identified ischemic tissues were harvested; formalin fixed; paraffin embedded and cut into 5 μm for CD31 immunofluorescence. (A) Control group; (B) model group; (C) cerebral infarction model group treated with Rg1; (D) cerebral infarction model group treated with PATRC; (E) microvessels quantity in cerebral infarction area of different groups. Scale bar was 100 μm. *p < .05, **p < .01.