
Figures & data
Figure 1 HPLC analysis of MAH monomer (flow rate: 0.5 mL/min, methanol-water elution (80–20 v/v), wavelength: 254 nm).
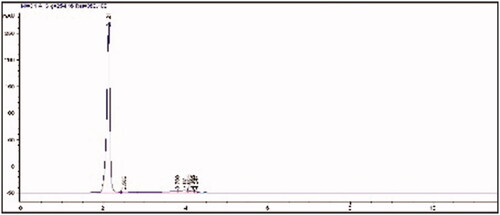
Figure 2 Zeta sizer measuments of MIP (a) and NIP (b).
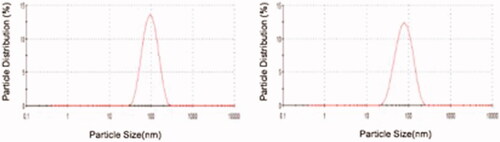
Figure 3 FTIR-ATR spectrum of MIP attached QCM surface.
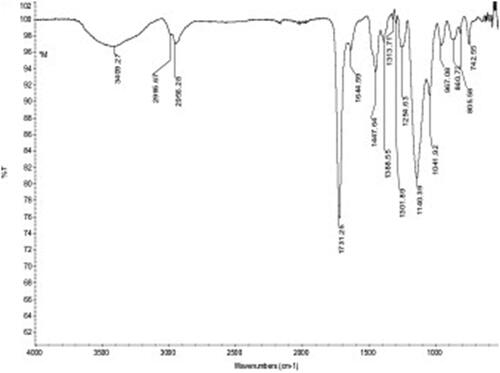
Table 1. Contact angle measurements.
Figure 4 Contact angle measurements of non-modified QCM gold surface (a), MIP attached QCM gold surface (b), NIP attached QCM gold surface (c).
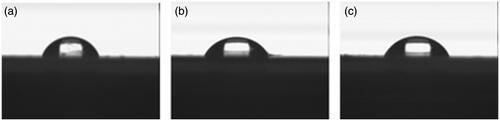
Figure 5 Real-time responses of MIP QCM biosensor against aqueous solutions of l-histidine at different concentrations in 10 mM phosphate buffer, pH 7.4 at a flow rate of 1.0 mL/min, (a) frequency change, (b) mass change.
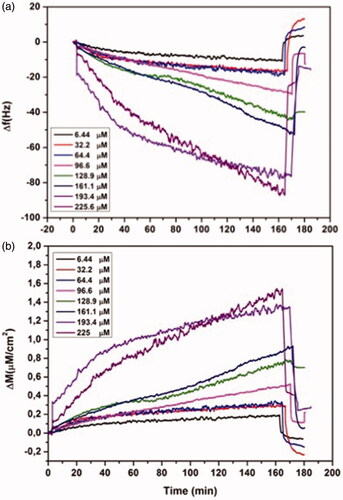
Figure 6 Real-time responses of MIP QCM biosensor against aqueous solutions for l-histidine, D-histidine, l-tryptophan (a) and binary mixtures (b). Experimental conditions; pH 7.4, flow rate: 1.0 mL/min, concentration of l-histidine, d-histidine, l-tryptophan: 96.6 µM.
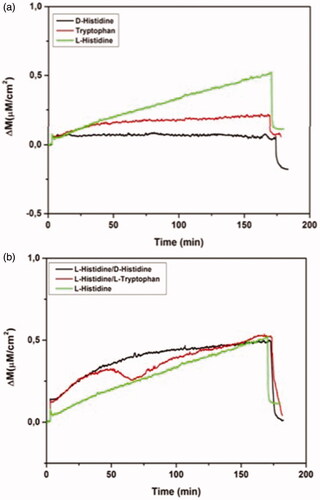
Figure 7 Real-time responses of NIP QCM biosensor against aqueous solutions for l-histidine, D-histidine, l-tryptophan. Experimental conditions; pH 7.4, flow rate: 1.0 mL/min, concentration of l-histidine, d-histidine, l-tryptophan: 96.6 µM.
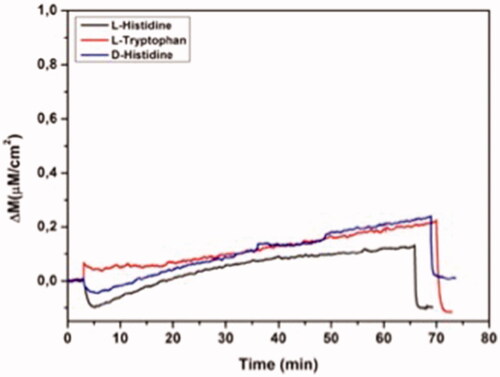
Table 2. Selectivity and relative selectivity coefficients for l-histidine against d-histidine and l-tryptophan.
Table 3. Kinetic rate constants.
Figure 8 Real-time responses of MIP QCM biosensor against aqueous solutions for RNAase, lysozyme, cytochrome-C, l-histidine and BSA. Experimental conditions; pH 7.4, flow rate: 1.0 mL/min, concentration of RNAase, lysozyme, cytochrome-C, l-histidine and BSA: 96.6 µM.
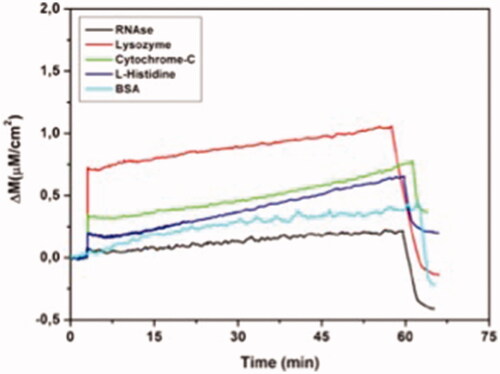
Figure 9 Reproducibility of MIP QCM biosensor. Experimental conditions; pH 7.4, flow rate: 1.0 mL/min, concentration of l-histidine: 96.6 µM.
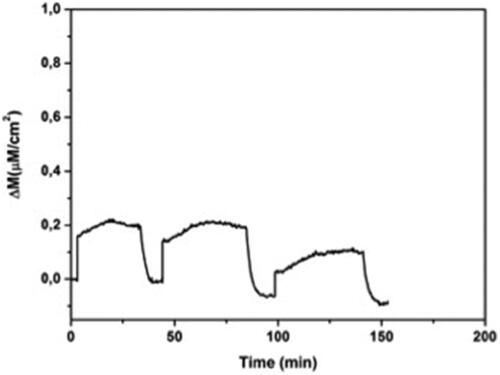
Table 4. Equilibrium isotherm models.