Figures & data
Figure 1. Graphic demonstration of steps involved in the electrospun nanofiber mat production.
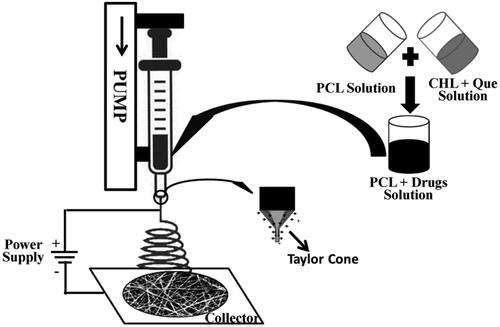
Table 1. Fibre morphology, average diameter, porosity and entrapment efficiency of nanofiber membrane of different compositions.
Table 2. ‘Time-dependent’ DPPH scavenging efficacy of ciprofloxacin HCl and quercetin loaded nanofiber in PBS (pH 7.4).
Figure 2. HR-SEM images of electrospun nanofiber: F1- PCL nanofiber (8% w/v), F2- PCL nanofiber (12% w/v), F3- PCL/CHL nanofiber, and F4- PCL/CHL/Que nanofiber.
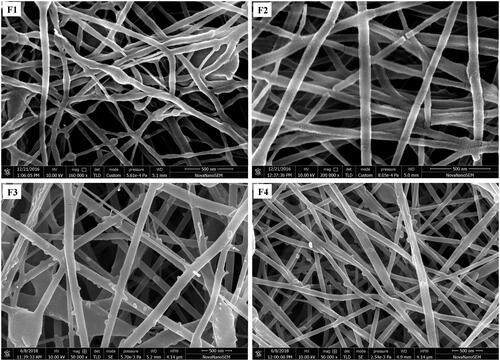
Figure 3. Two dimensional and three dimensional morphology of PCL/CHL/Que nanofiber showing bead-free and continuous nanofiber.
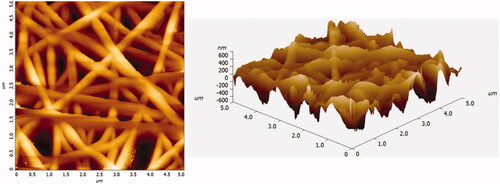
Figure 4. In-vitro cumulative drug release profiles of ciprofloxacin HCl and quercetin loaded nanofiber in PBS (pH 7.4). The data are represented as mean ± SD, n = 3.
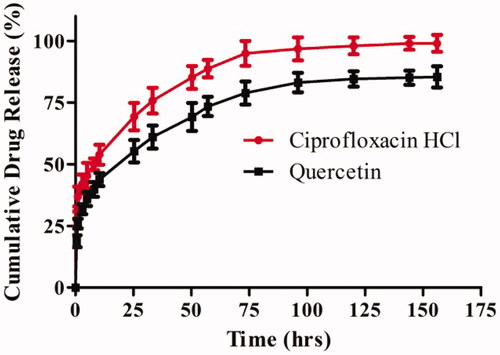
Figure 5. DPPH scavenging activity of nanofiber on ‘fixed reaction time’: (i) UV-visible spectra of different DPPH solution after 30 min incubation; (ii) bar graph comparing the scavenging efficacies of different nanofiber. ap < .05 compared to PCL-NF; bp < .05 compared with PCL/CHL-NF. The data represented as mean ± SD, n = 3.
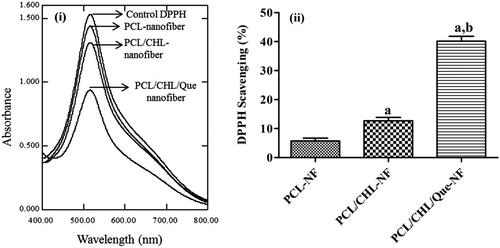
Figure 6. Agar plate showing the growth inhibition zone of S. aureus on (i) day 1, and (ii) day 7. F2, F3, and F4 represent PCL, PCL/CHL, and PCL/CHL/Que loaded nanofiber. Graph (iii) outline the relation between inhibition zone (mm) and time (days). The data represented as mean ± SD, n = 3.
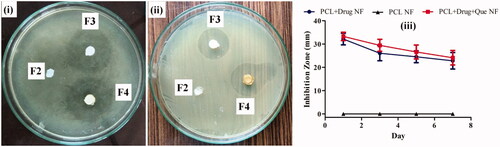
Figure 7. Biocompatibility of fabricated scaffold: (i) haemolysis activity of different nanofiber. ap < .05 compared to PCL-NF; bp < .05 compared with PCL/CHL-NF, and (ii) viability of fibroblast cells after treatment with the extract of different nanofiber. *p < .05 versus control. The data are represented as mean ± SD, n = 3.
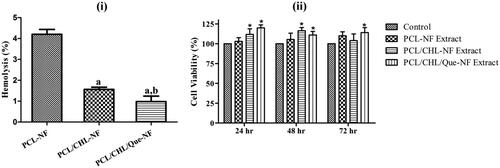
Figure 8. In-vivo healing of full thickness wound: (i) images of wounds, and (ii) wound area closure rate after treatment with gauze, PCL, PCL/CHL, PCL/CHL/Que-nanofiber at different time interval. *p < .05, **p < .01 and ***p < .001 versus gauze treated group; #p < .05, ##p < .01 and ###p < .001. The data are expressed as means ± SD, n = 6.
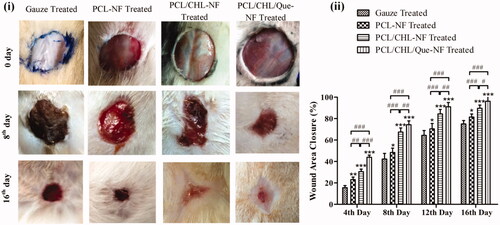
Figure 9. Haematoxylin − eosin stained slice showing histological changes in granulation tissue after treatment with gauze, PCL-NF, PCL/CHL-NF and PCL/CHL/Que-NF.
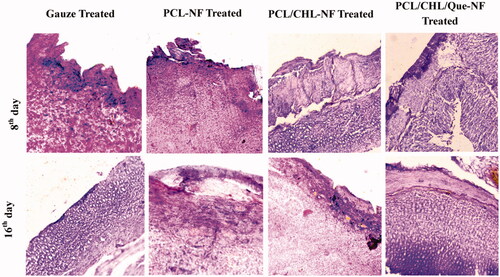
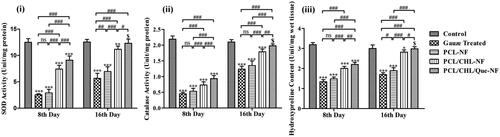
Figure 10. Biochemical assessment of granulation tissue harvested from wound area in terms of (i) SOD, (ii) catalase activity, and (iii) hydroxyproline content on day 8th and 16th. *p < 0.05, **p < .01, ***p < .001, and $p > .05 versus gauze treated group; #p < .05, ##p < .01, ###p < .001 and nsp > .05. The data are expressed as means ± SD, n = 6. Control is an unwounded group.