Figures & data
Figure 1. Characterization of AgNPs: (A) TEM analysis of AgNPs; (B) AgNPs size, hydrodynamic diameter and zeta potential.
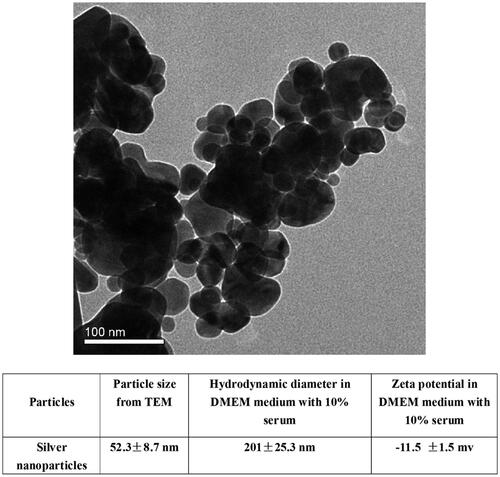
Figure 2. Uptake and retention of AgNPs in MG-63 cells. A: Results of ICP-MS showing a significant increase in silver content of MG-63 cells after exposure to AgNPs for 24, 48, and 72 h and after 24, 48, and 72 h of termination of exposure (N = 5). B: TEM images of MG63 cells without (B1, B4), with (B2, B5) exposure to AgNPs (5 μg/mL) for 72 h, and at 72 h after termination of exposure to AgNPs (B3, B6).
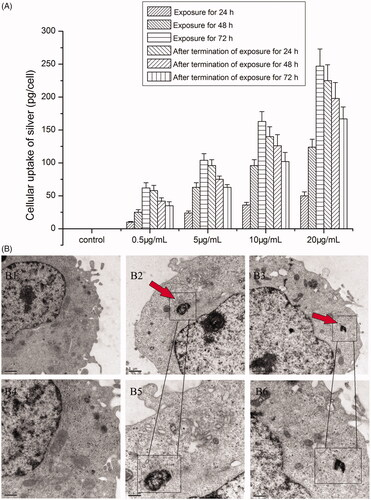
Figure 3. Effects of AgNPs on the viability and the LDH levels of MG-63 cells. (A) The viability of MG-63 cells treated with different concentrations of AgNPs for 24, 48, and 72 h and at 24, 48, and 72 h after termination of exposure was measured by MTS assay; (B) LDH level of MG-63 cells cultured in media containing varied concentrations of AgNPs for 24, 48, and 72 h and at 24, 48, and 72 h after termination of exposure. (n = 5, *p < .01 vs. control, # p < .05 vs. control; 24, 48, and 72 h: AgNPs treatment for 24, 48, and 72 h; T-24 h, T-48 h and T-72 h: termination of AgNPs exposure for 24, 48, and 72 h).
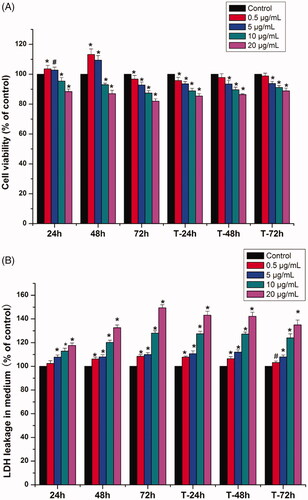
Figure 4. Cytoskeleton morphology and fluorescence intensity of MG-63 cells treatment with AgNPs and after termination of AgNPs treatment. A-E: Observation of cytoskeleton morphology (CLSM ×20). A: control; B: 0.5 μg/mL AgNPs treatment for 72 h; C: Termination of 0.5 μg/mL AgNPs treatment for 72 h; D: 5 μg/mL AgNPs treatment for 72 h; E: Termination of 5 μg/mL AgNPs treatment for 72 h. F: Fluorescence intensity of MG-63 cells cytoskeleton (*p < .05 vs. control, # p < .05 vs. T-5 μg/mL). con: control group; 0.5 μg/mL: 0.5 μg/mL AgNPs exposure for 72 h; T-0.5 μg/mL: termination of 0.5 μg/mL AgNPs exposure for 72 h; 5 μg/mL: 5 μg/mL AgNPs exposure for 72 h; T-5 μg/mL: termination of 0.5 μg/mL AgNPs exposure for 72 h)
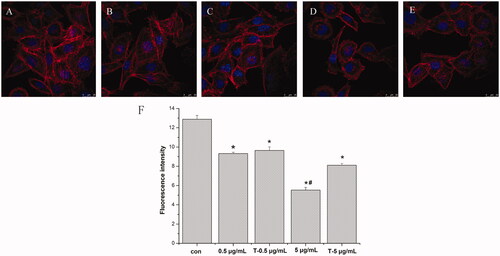
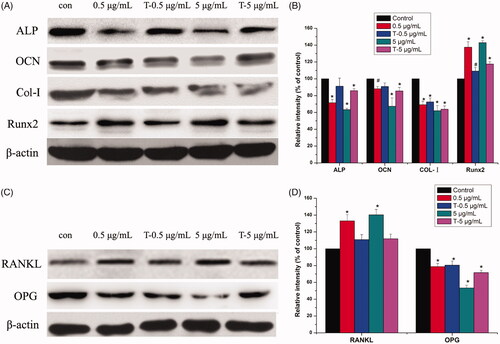
Figure 5. Western blot analysis of expressions of ALP, OCN, Col-I, Runx2, RANKL and OPG in MG-63 cells induced by AgNPs. A: Expression of osteogenic related proteins. B: Densitometry showing data from three experiments. C: Expression of osteoclast-related proteins. D: Densitometry showing data from three experiments. (n = 3, *p < .01 vs. control, # p < .05 vs. control; con: Control group; 0.5 μg/mL: 0.5 μg/mL AgNPs exposure for 72 h; T-0.5 μg/mL: termination of 0.5 μg/mL AgNPs exposure for 72 h; 5 μg/mL: 5 μg/mL AgNPs exposure for 72 h; T-5 μg/mL: termination of 0.5 μg/mL AgNPs exposure for 72 h).