Figures & data
Figure 1. Identification of putative miR direct targets networks from Broad GDAC Firehose by analyzing TCGA PRAD sequencing data.
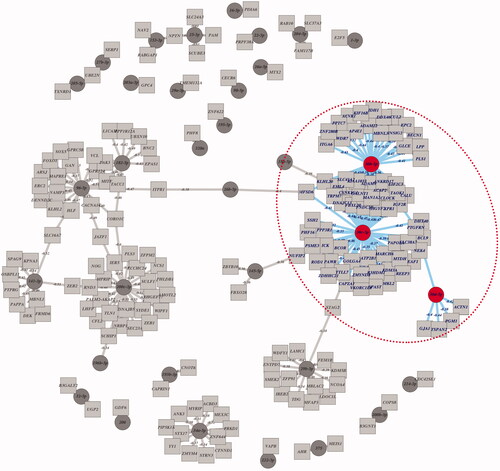
Figure 2. Expression profiles of miR-30 family in TCGA tumour samples and GO-term enrichment analysis of its target genes by mirPath3. (A) Heatmap results of differential expression patterns of miR-30 family in TCGA (tumour vs normal) samples. Green and red indicate downregulated and upregulated miRNA expression in the corresponding datasets, respectively. (B) Heatmap of KEGG pathways enriched in miR-30 family target genes. (C) Heatmap of GO BP/CC/MF analysis of miR-30 family target genes.
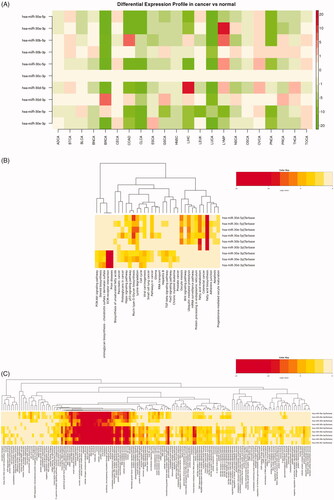
Figure 3. Expression pattern and clinical significance of miR-30a-5p in prostate cancer tissues. (A) The comparison of miR-30 family expression abundance in human normal prostate tissues. (B) Secondary structure of miR-30a predicted by miRNAMap. (C) miR-30a-5p was downregulated in both TCGA-PRAD and GSE6636 prostate cancer datasets. (D) Comparison of miR-30a-5p expression in prostate cancer patients (n = 20) and normal controls (n = 20) were analyzed by qRT-PCR. Data were presented as mean ± SEM, ***p < .001 compared with normal controls. (E) Negative correlation between the expression of miR-30a-5p and the T- or N-stage in TCGA-PRAD revealed by LinkedOmics, p = 5.49e-10, 1.99e-03.
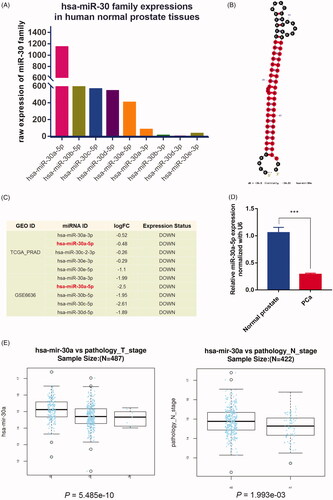
Figure 4. miR-30a-5p inhibits cellular proliferation in PC-3 cells. (A) PC-3 cells are transfected with a miR-30a-5p mimics/inhibitor or NC, and the expression of miR-30a-5p is quantified by real-time PCR. Data were presented as mean ± SEM, **p < .01, ****p < .0001 compared with NC. (B) MTT assay reveals that miR-30a-5p mimics inhibited cell growth significantly while miR-30a-5p inhibitors stimulated cell growth compared to NC. Each bar represents the mean of three independent experiments (*p < .05, **p < .01 compared with NC, one-way ANOVA). (C) Representative graphs of miR-30a-5p mimics or inhibitors regulating cell proliferation as indicated by colony-formation assay. (D) Quantification of colonies that are larger than 0.1 mm was scored. Each bar represents the mean of three independent experiments (*p < .05, ****p < .0001 compared with NC, one-way ANOVA).
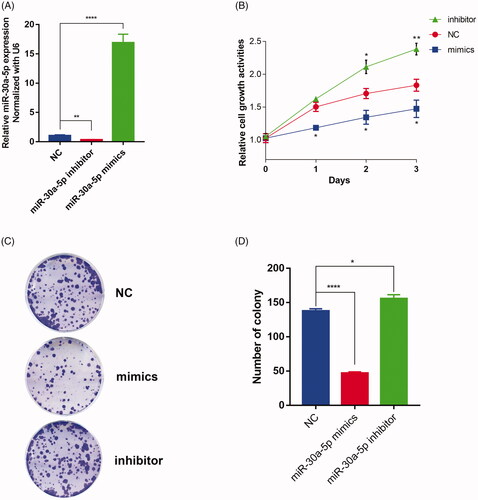
Figure 5. PCLAF is a miR-30a-5p target. (A) Full length of PCLAF 3’UTR region and its conserved sites for miRNA families predicted by TargetScanHuman 7.2. (B) Position 89–95 of PCLAF 3’UTR is predicted to be targeted by all miR-30-5p isoforms. (C) Position 89–95 of PCLAF 3′UTR targeted by miR-30a-5p is highly conserved among vertebrates. (D) Schematic illustrating the construction of luciferase reporter plasmids PCLAF WT UTR and PCLAF mutant UTR. (E) Luciferase assay is conducted and all data were reported as mean ± s.e.m. p values are calculated based on at least three independent experiments. ***p < .001. (F) qRT-PCR analysis of endogenous PCLAF mRNA expressions in PC-3 cells transfected with miR-30a-5p mimics or miR-30a-5p inhibitor; data are expressed relative to the corresponding NC cells, **p < .01, ***p < .001. (G) miR-30a-5p and PCLAF expressions show negative correlation in TCGA-PRAD data analyzed by miRTarBase. (H) LinkedOmics also revealed significant negative correlation between miR-30a-5p and PCLAF in TCGA-PRAD samples. R= −0.2344, p = 1.4e-07.
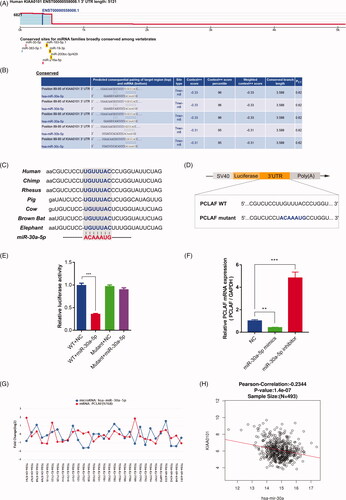
Figure 6. Expression profiles and clinical significance of PCLAF in prostate cancer samples. (A) Up-regulated PCLAF mRNA expressions in TCGA primary prostate cancer samples uncovered by UALCAN, p = 2.49e-06. (B) PCLAF expressions correlated with clinical characteristics of Gleason score 7, 8, 9, 10, p = 2.04e-02, 1.15e-04, 7.03e-11, 1.97e-12. (C) Positive correlation between the expression of PCLAF and the T-stage (left) or N-stage (right) in TCGA-PRAD revealed by LinkedOmics, p = 5.51e-08, 2.66e-03. (D) cBioPortal Kaplan-Meier survival analysis for PCLAF with or without alterations on 500 prostate cancer patients with death outcome, p = 2.75e-04.
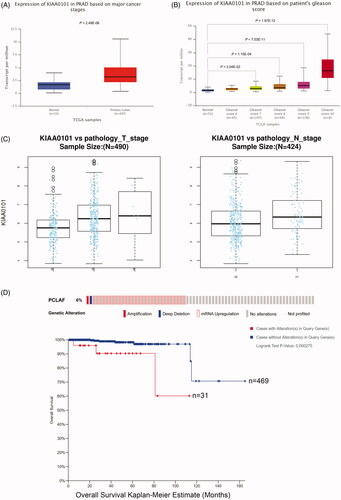
Figure 7. Downregulation of PCLAF inhibits the proliferation of PC-3 cells. (A) PCLAF mRNA expressions in all CCLE prostate cancer cell lines. (B) Construction of stably shPCLAF cell lines is determined by qRT-PCR. (C) Cell proliferations measured by MTT assay (24, 48, 72 h time points) of shCtrl and shPCLAF PC-3 cells. (D) Cell proliferation rates could be also reflected by GFP immunofluorescence staining (24, 72 h time points) in shCtrl and shPCLAF PC-3 cells. All the experiments were performed at least three times and representative results are displayed as mean ± SD. *p < .05, **p < .01, ***p < .001.
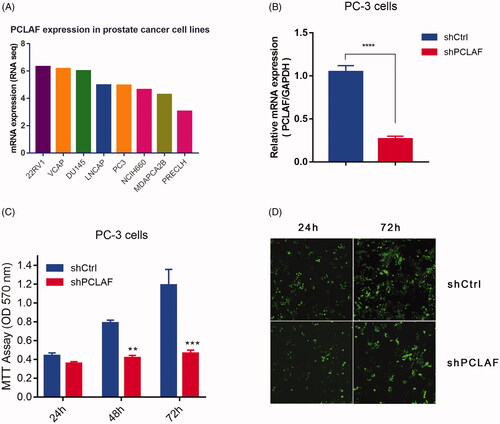
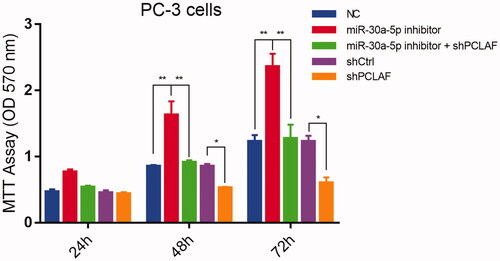
Figure 8. miR-30a-5p regulates prostate proliferation by targeting PCLAF. MiR-30a-5p inhibitor promoted PC-3 cell proliferation. The cells transfected with the indicated NC or inhibitor were subjected with MTT assays. The rescue experiments for miR-30a-5p inhibitions were performed by transfection of shPCLAF in miR-30a-5p inhibitor-treated cells. All the experiments were performed at least four times and representative results are displayed as mean ± SD. *p < .05, **p < .01.