Figures & data
Figure 1. The chemical structure of ICA.
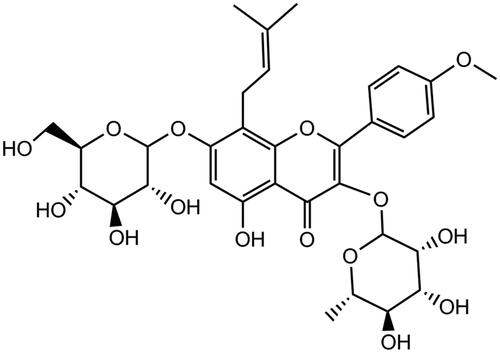
Figure 2. The chemical synthesis of mPEG-ICA.
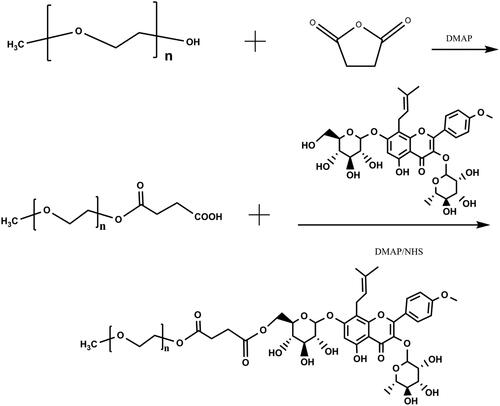
Figure 3. FTIR spectra of ICA (A), mPEG-COOH (B), and mPEG-ICA (C).
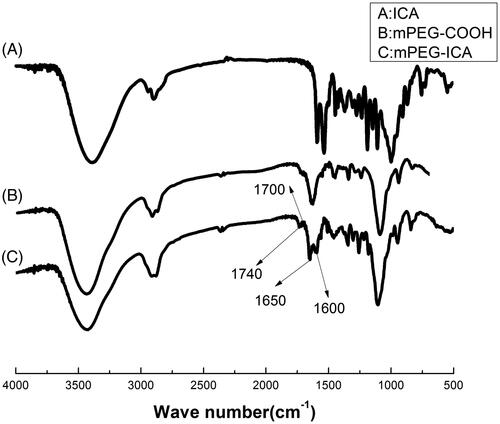
Figure 4. 1H NMR hydrogen spectra for mPEG-COOH and mPEG-ICA.
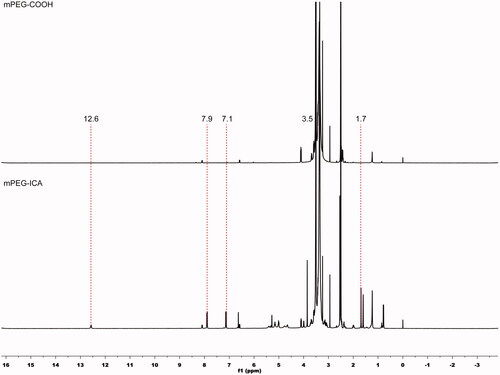
Figure 5. Particle size, zeta potential, and TEM of mPEG-ICA NPs.
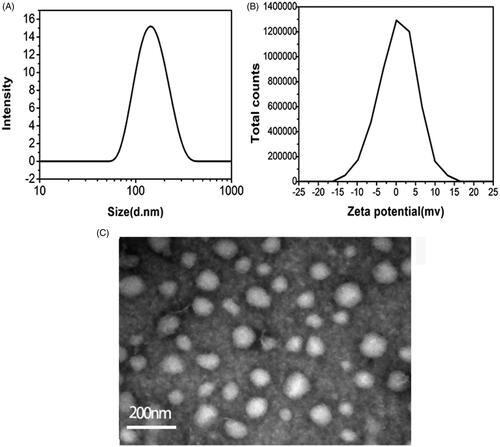
Figure 6. ICA release from mPEG-ICA NPs in PBS of pH 7.4 (■) and pH = 6.8 (●) at 37 °C in vitro.
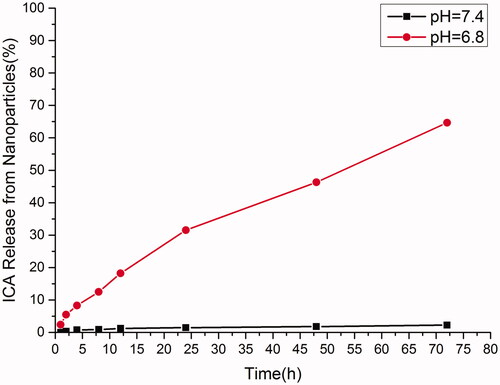
Figure 7. Cell viability in OGD-induced H9c2 cells were measured by MTT assay. OGD: oxygen-glucose deprivation; ICA: icariin. Data are mean ± SD. **p < 0.01 vs normal culture; ##p < 0.01 vs OGD.
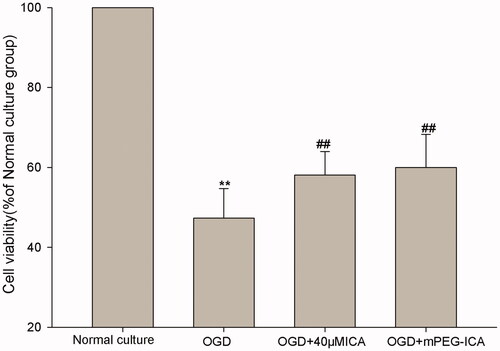
Figure 8. LDH releases in OGD-induced H9c2 cells. Data are mean ± SD. **p < 0.01 vs normal culture; ##p < 0.01 vs OGD.
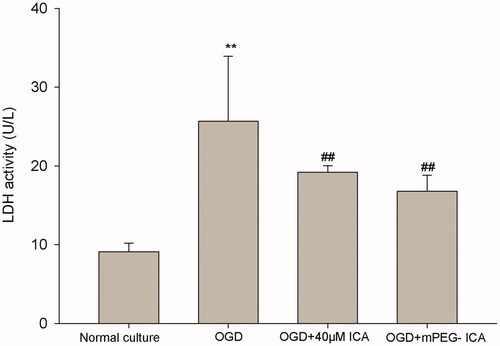
Figure 9. Detection of apoptosis by Hoechst 33258 staining. (A) Cells with Hoechst 33258 staining; (B) Apoptosis rate. Data are mean ± SD. **p < 0.01 compared with normal culture; ##p < 0.01 compared with OGD; & p < 0.05 compared with OGD + ICA. n = 8.
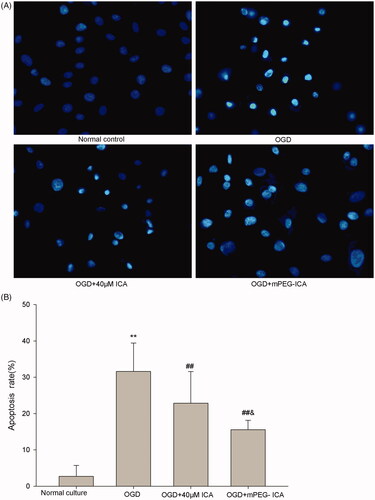
Figure 10. Apoptotic rate detected by flow cytometry. H9c2 cells were stained by AnnexinV/PI double staining. Q1-LL cells were AnnexinV/PI double-negative stained, indicating viable cells; Q1-LR cells were AnnexinV-positive and PI-negative stained, indicating early apoptosis; Q1-UR cells were AnnexinV/PI double-positive stained, indicating late apoptosis.
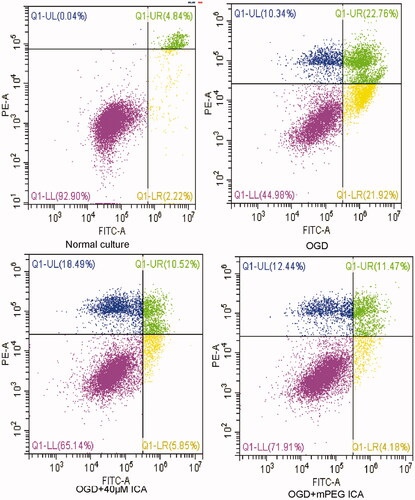
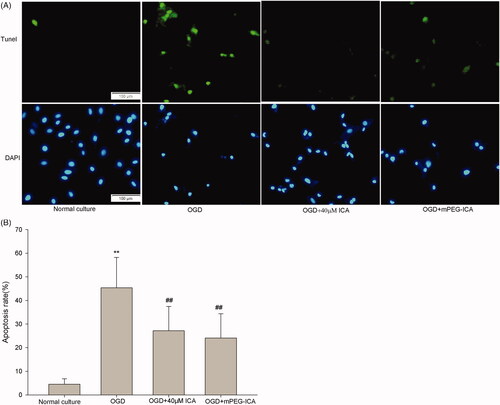
Figure 11. Detection of apoptotic cell nuclei by TUNEL staining. (A) H9c2 tunnel staining; green fluorescence indicates apoptotic cells, blue fluorescence nuclear DAPI staining; (B) Quantification. Data are mean ± SD. **p < 0.01 compared with normal culture, ##p < 0.01 compared with OGD.