Figures & data
Figure 1. Detailed characterization of HspNPs. Particle size distribution (a) and zeta potential (b) analysis of nanoparticles as obtained by Zetasizer. SEM image (c) and particle size distribution (obtained from SEM) with Gaussian fit (d) of HspNPs, FT-IR analysis of PLGA , Hsp and HspNPs (e), Cumulative release of Hsp form HspNPs (f).
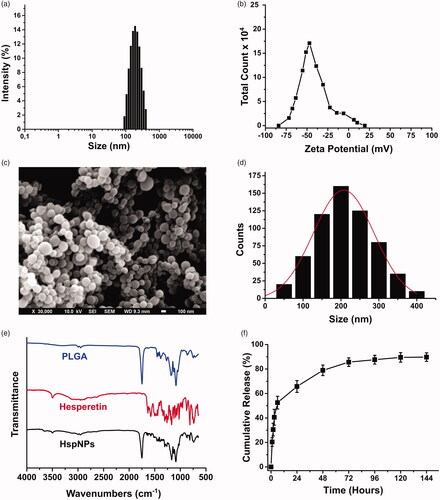
Figure 2. Cytotoxic effect of Hsp and HspNPs on C6 glioma cells as determined by MTT assay. Both 24 h (a) and 48 h (b) incubation of C6 glioma cells with Hsp and HspNPs resulted in significant dose and time dependent decrease in cell viability (24h incubation with Hsp and HspNP p = .038, p = .036; 48h incubation with Hsp and HspNP p = .036, p = .028 respectively). Data are shown as mean ± SD of three separate experiments (n = 3).
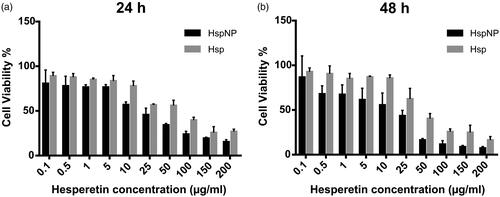
Figure 3. Dose and time dependent inhibition of cell proliferation on C6 glioma cells by Hsp and HspNPs. (a) 24 h and (b) 48-h treatment with Hsp and HspNPs showed decrease in PCNA positive cell number (p < .05). (c) Brightfield microscope images of C6 glioma cells after 24 and 48 h treatment with Hsp and HspNPs. 48 h incubation with 100 µg/ml HspNPs resulted in significant decrease on proliferation of C6 glioma cells (p < .0001).
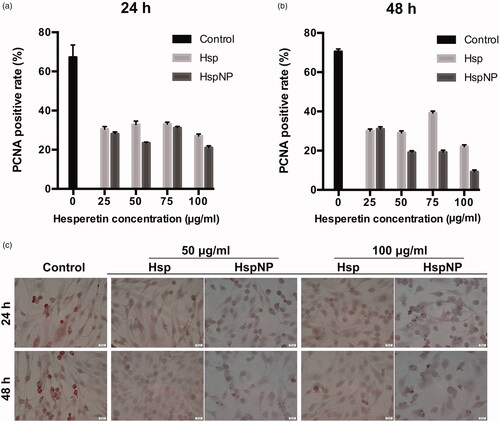
Figure 4. Apoptotic activitiy results of Hsp and HspNPs by TUNEL assay on C6 glioma cells. (a) 24 h and (b) 48 h treatment with Hsp and HspNPs showed increase in TUNEL positive cell number. (c) The highly condensed and fragmented nuclei that are the index of apoptosis were observed at increasing concentrations of both molecules. *p < .05, **p < .001, ***p < .0001 compared to control.
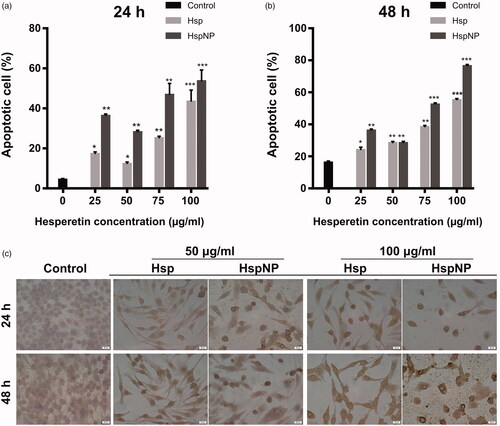
Figure 5. MDA levels were measured to determine intracellular reactive oxygen species (ROS) generation in C6 glioma cells after (a) 24 h and (b) 48-h treatment with Hsp and HspNPs. *indicate statistically significant differences compared to control (p < .05).
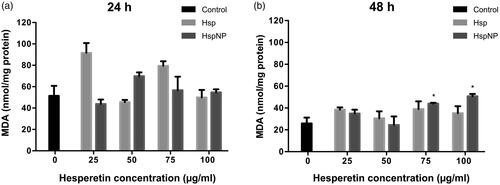
Figure 6. The effect of Hsp and HspNPs treatment in C6 glioma cells on SOD activity. (a) 24 h (b) 48 h incubation of cells with increasing concentrations Hsp and HspNPs. *indicate statistically significant differences between Hsp and HspNPs (p < .05).
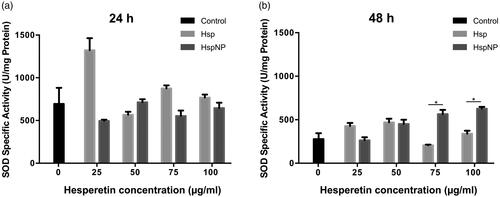
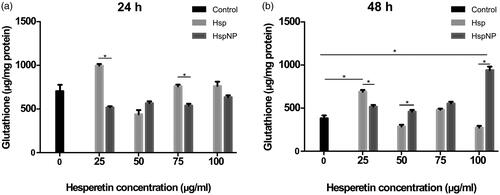
Figure 7. Evaluation of dose and time dependent changes in GSH levels on C6 glioma cells treated with Hsp and HspNPs. (a) 24 h (b) 48-h incubation of cells with increasing concentrations Hsp and HspNPs. *indicates statistically significant differences between underlined groups (p < .05).