Figures & data
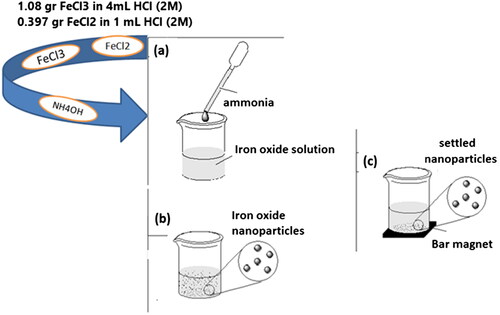
Scheme 1. Schematic representation of the synthesis route of the SPIONs. (a) ammonia addition, (b) iron oxide nanoparticles formation, (c) separation and washing with permanent magnet.
Scheme 2. Schematic representation of the synthesis route of the FA-mPEG-PAMAM G3-CUR@SPIONs. (Carboxylic acid group of folic acid reacts with the primary amine end groups of dendrimer).
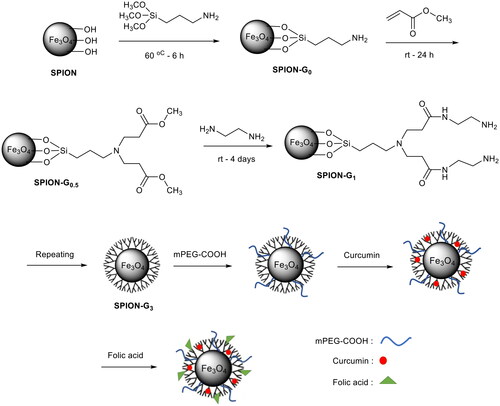
Figure 1. XRD pattern of the synthesized magnetite nanoparticles.
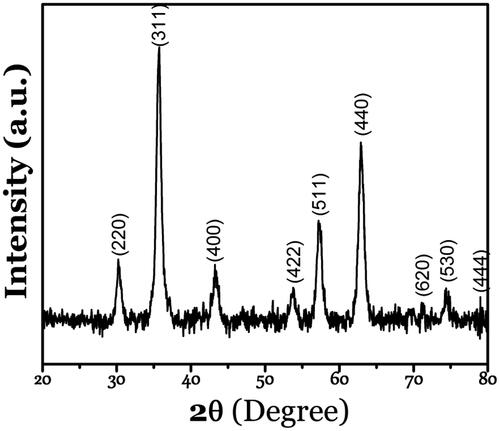
Figure 2. (a, b) TEM micrograph and corresponding size distribution histogram of the synthesized nanocomplex. (c) Hydrodynamic size distribution of the nanocomplex obtained by DLS analysis.
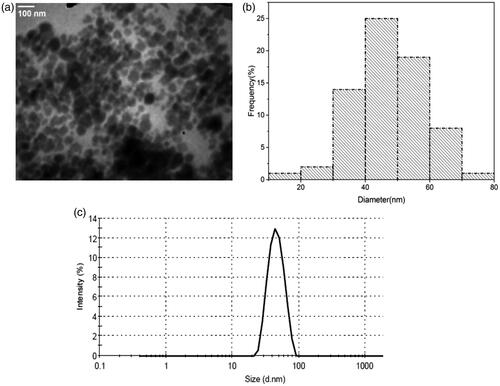
Figure 3. Magnetization curve of magnetite nanoparticles and the synthesized nanocomplex.
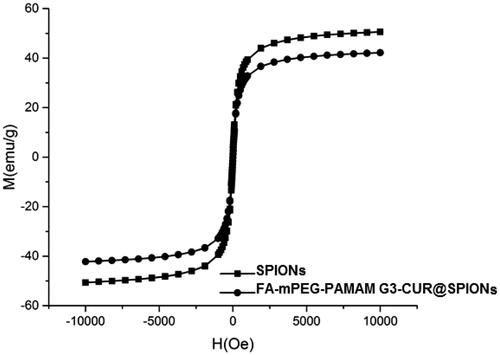
Figure 4. UV-vis spectra show the surface plasmon resonance of curcumin (purple line), dendrimer nanoparticles without drug (orange line) and dendrimer nanoparticles with drug (green line).
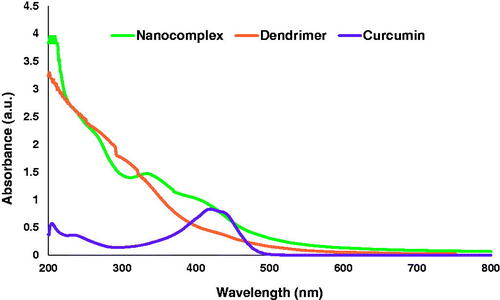
Figure 5. FTIR spectra of folic acid (a); FTIR spectra of curcumin-dendrimer nanocomplex (b); FTIR spectra of folic acid-curcumin-dendrimer nanocomplex (c).
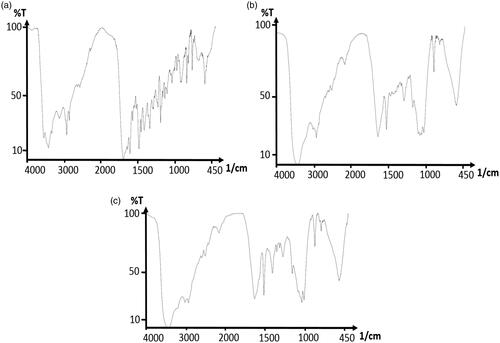
Figure 6. The in vitro release profile of the encapsulated curcumin from the nanocomplex versus free-from curcumin.
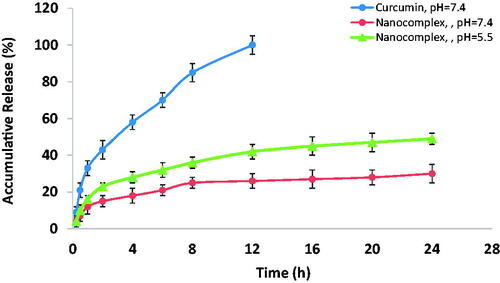
Figure 7. The viability of KB and MCF-7 cells incubated with different concentrations of the nanocomplex for 12 h.
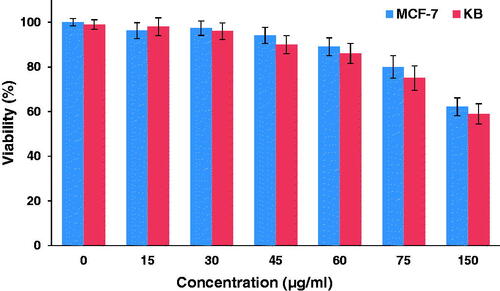
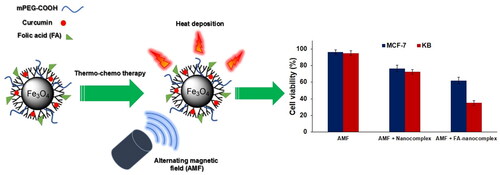
Figure 8. The viability of KB and MCF-7 cells after receiving various treatments including AMF (100 kHz; 10 kOe; 20 min), AMF + nanocomplex (30 µg/ml; 12 h) with and without folic acid (FA) modification.
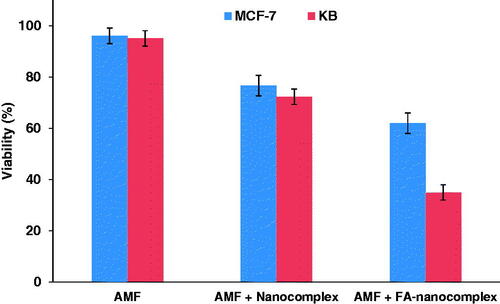
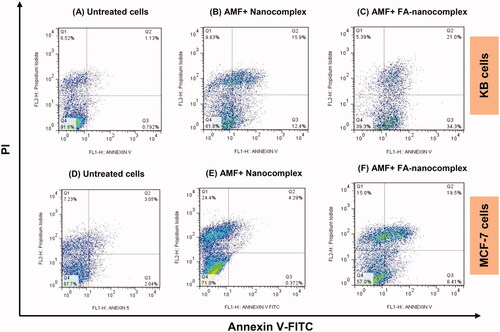
Figure 9. Flow cytometric analysis to determine the death modes of KB and MCF-7 cells pretreated with the nanocomplex (30 µg/ml; 12 h) with and without folic acid (FA) modification followed by AMF (100 kHz; 10 kOe; 20 min) compared to untreated cells.