Figures & data
Figure 1. Photograph showing of (A) pure hesperidin and (B) modified nanohesperidin loaded in PLGA- Polixamar 407 powder.
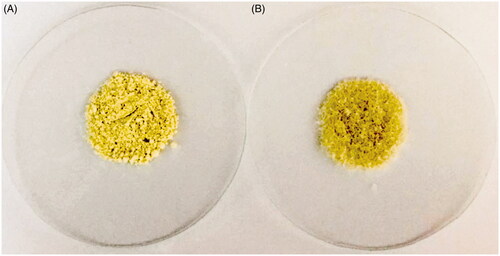
Figure 2. Photograph showing the solubility of (A) pure hesperidin and (B) modified nanohesperidin loaded in PLGA- Polixamar 407 in water after 5 min, 12 h and 24 h of preparation, respectively.
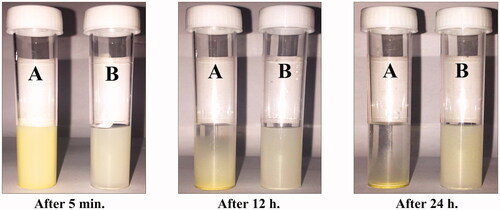
Figure 3. Profile of In vitro release of modified nanohesperidin loaded in PLGA- Polixamar 407.
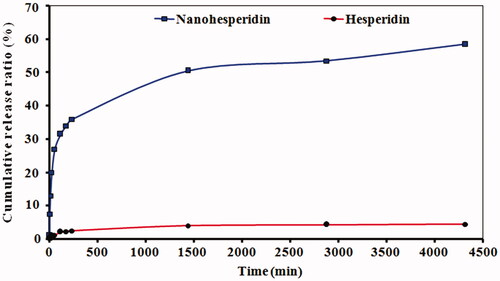
Figure 4. XRD spectrum patterns of (A) pure hesperidin and (B) modified nanohesperidin loaded in PLGA- Polixamar 407.
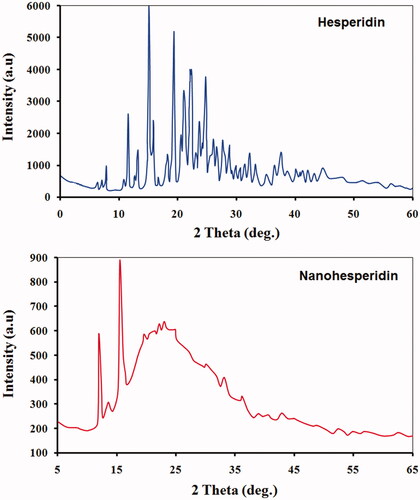
Figure 5. FTIR spectroscopy analysis of of (A) pure hesperidin and (B) modified nanohesperidin loaded in PLGA- Polixamar 407.
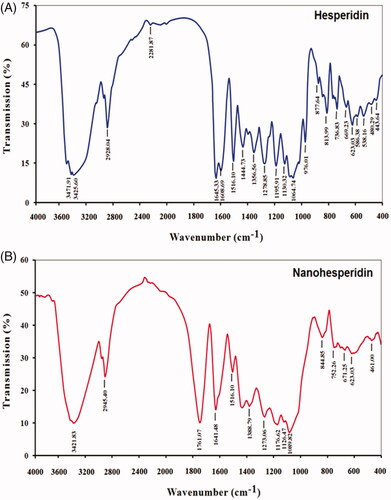
Figure 6. SEM image of (A) pure hesperidin and (B) modified nanohesperidin loaded in PLGA- Polixamar 407.
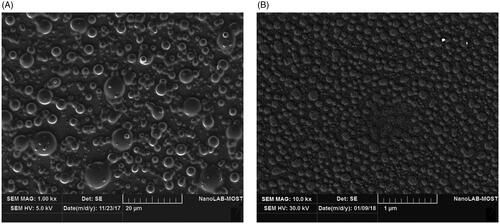
Figure 7. Particle size analysis of (A) pure hesperidin and (B) modified nanohesperidin loaded in PLGA- Polixamar 407.
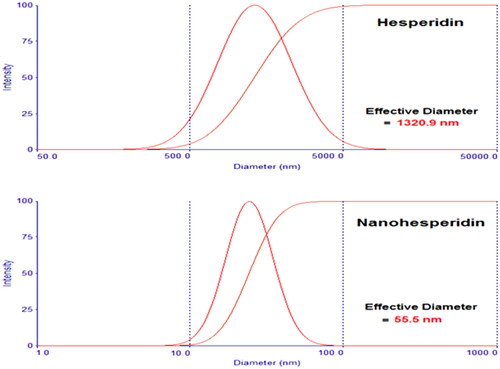
Figure 8. DPPH free radical scavenging activity of pure hesperidin and modified nanohesperidin loaded in PLGA- Polixamar 407 at different concentrations (40, 80, 120, 160 and 200 µg mL−1). The values represent the mean ± SD of three experiments. Vit.C, Vitamin C was used as positive control.
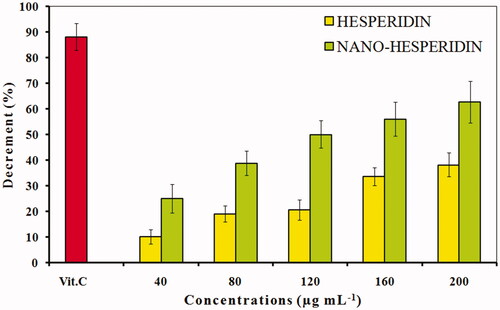
Figure 9. The reaction scheme between DPPH free radicals and hesperidin.
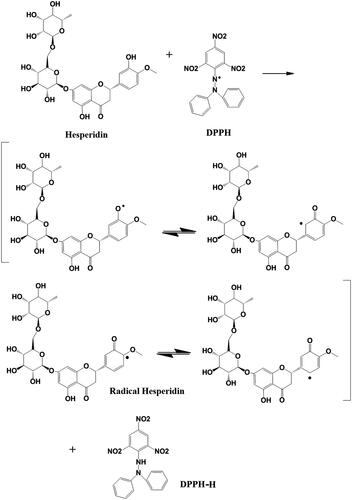
Figure 10. The highest occupied molecular orbital (HOMO) distribution and lowest unoccupied molecular orbital (LUMO) distribution of hesperidin radical molecules.
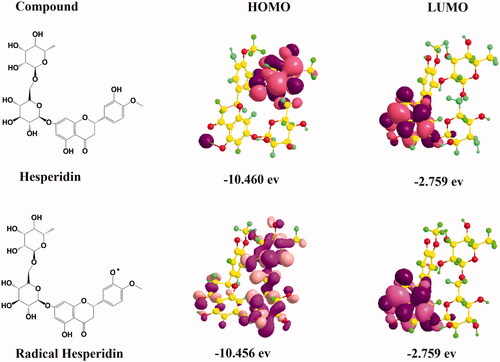
Figure 11. A260 histogram of structural alteration of the standard DNA double helix sample of pure hesperidin and modified nanohesperidin loaded in PLGA- Polixamar 407.
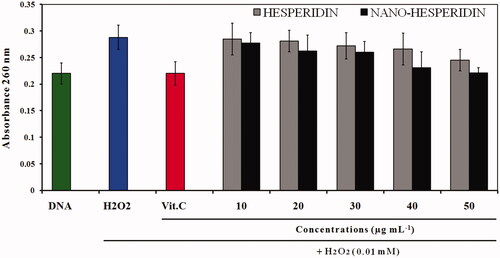
Figure 12. Images of human RBCs showing percentage of blood haemolysis on incubation with different concentrations of (A) pure hesperidin and (B) modified nanohesperidin loaded in PLGA- Polixamar 407.
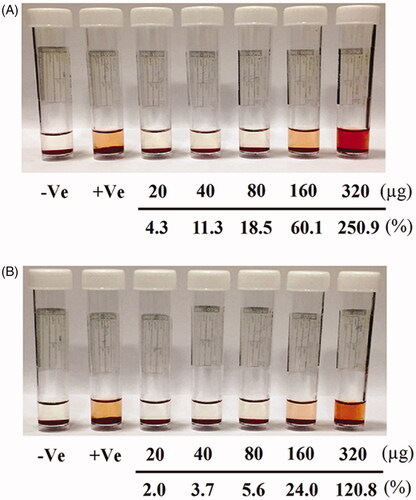
Figure 13. Light microscope photographs of RBCs treated with two concentrations (20 and 160 (µg mL−1) of pure hesperidin and (B) modified nanohesperidin loaded in PLGA- Polixamar 407.
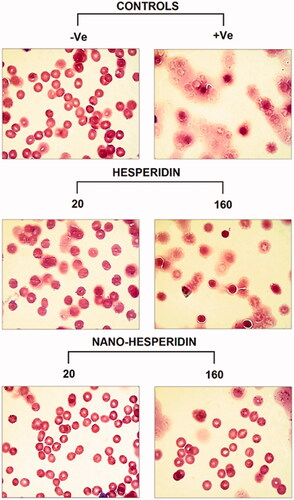
Figure 14. Colony formation assay of (A) non treated MCF-7cells and (B) treated cells with pure hesperidin (upper lane) and modified nanohesperidin loaded in PLGA- Polixamar 407 (lower lane).
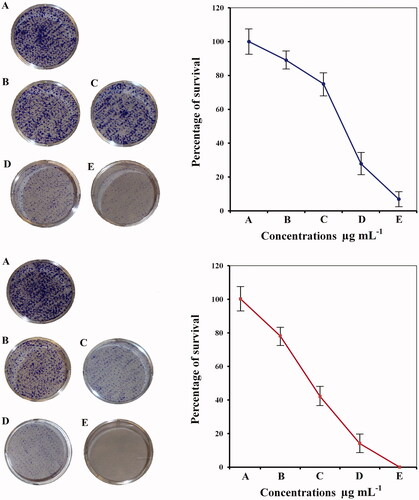
Figure 15. Microscopic images of MCF-7 cells treated with modified nanohesperidin loaded in PLGA- Polixamar 407 and stained with crystal violet.
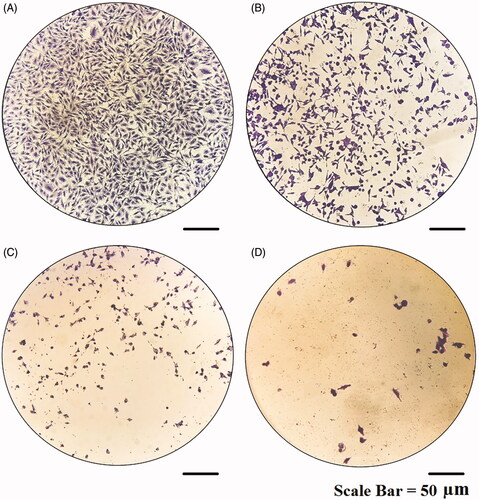
Figure 16. Fluorescence microscopy photographs of MCF-7 cells treated with modified nanohesperidin loaded in PLGA- Polixamar 407 and stained with SR 101.
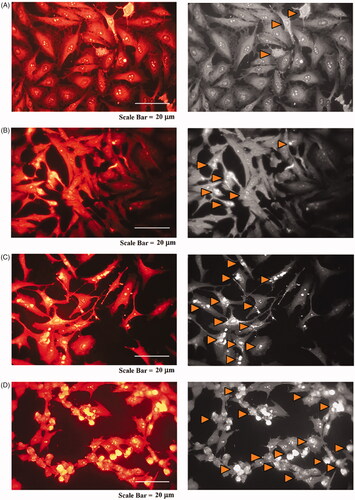
Figure 17. Immunostaining of caspase-3 (left lane) and P53 (right lane) of MCF-7 cells. (A) Non treated cells, (B) cells treated with 20 and (C) cells treated with 40 µg mL−1 of modified nanohesperidin loaded in PLGA- Polixamar 407.
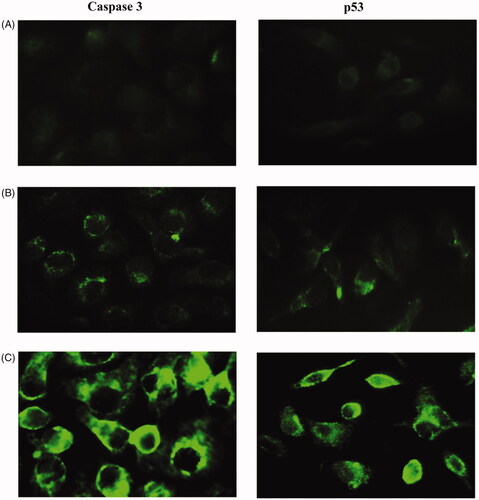
Figure 18. Comet assay for MCF-7 cells treated with modified nanohesperidin loaded in PLGA- Polixamar 407. Class 0: intact cell with normal nucleus, Class 1: halo around the nucleus, Class 2 and Class 3: Gradual increases in the length of comet tail indicate more damage with a decrease in nuclear DNA content.
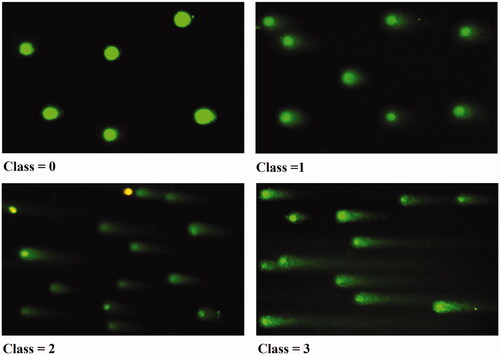
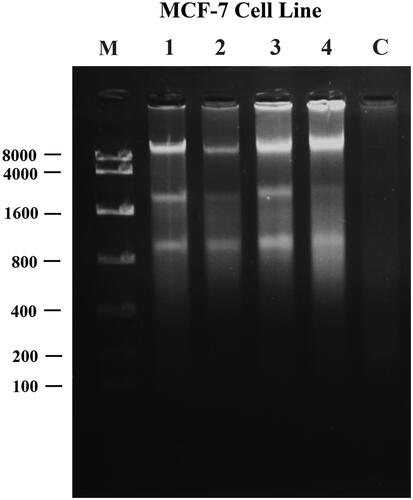
Figure 19. UV-Illumination images of fragmented DNA for MCF-7 cells treated with modified nanohesperidin loaded in PLGA- Polixamar 407. M: DNA marker with molecular weight ranged from 100 bp to 8000 bp; 1, 2, 3 and 4 (10, 20, 30, 40 µg mL−1, respectively); C: Control (non-treated cell).