Figures & data
Figure 1. Characterization of the prepared Au-LTSL-GA.A. (A) UV-Vis spectra of Au NRs. The extinction spectrum of Au NRs shows a localized surface plasmon resonance centered at 880 nm, which is within the biologically transparent spectral window. (B) FTIR spectra of LTSL, GA.A, LTSL- GA.A and Au-LTSL-GA.A after removing CTAB. (C) UV-Vis spectra of LTSL, GA.A, LTSL-GA.A and Au-LTSL-GA.A. (E) SEM image of LTSL-GA.A. (D, F) TEM images of Au-LTSL-GA.A. (G) The particle size distribution of LTSL-GA.A and Au-LTSL-GA.A in DLS image. (H) The Zeta potential of Au-LTSL-GA.A.
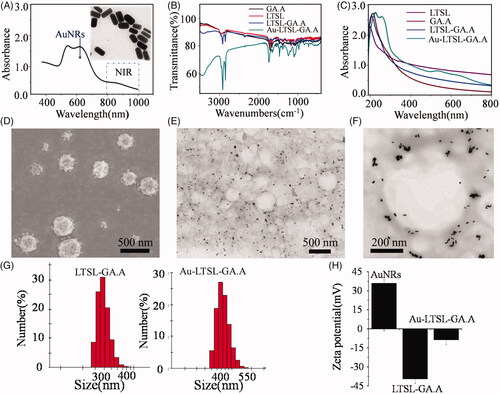
Figure 2. (A) Screening results for drug-resistant M. tetragenus, E. coli, B. subtilis, and S. aureus by CFU method, treated with Au-LTSL-GA.A (50 μg/mL). Error bars represent the standard deviations (n ≥ 3). (B) Photographs of bacterial colonies (E. coli and S. aureus were treated with GA.A, LTSL-GA.A, Au-LTSL-GA.A and Au-LTSL-GA.A + NIR irradiation) formed on LB-agar plates. Bacteria without NPs are blank. Cells were treated with different materials for 2 h in incubation and measured for 5 min upon irradiation (0.25 W/cm2).
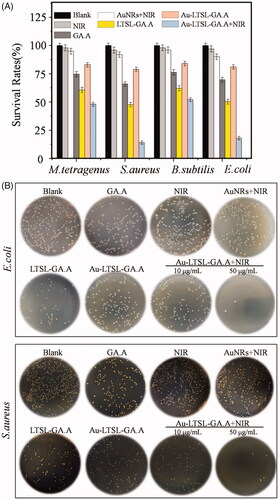
Figure 3. Fluorescence microscopic images of drug-resistant E. coli (A) and S. aureus (B) through the LIVE-DEAD stained assay. Cells treated with GA.A (50 μg/mL), LTSL-GA.A (50 μg/mL), Au-LTSL-GA.A (50 μg/mL) were set as control groups. Cells were treated with different concentration of Au-LTSL-GA.A (30 and 50 μg/mL) for 2 h in incubation and measured for 5 min upon irradiation (0.25 W/cm2). Cells were stained (for 30 min) with SYTO9 and PI for antibacterial activity. Overlay images were compared for the two kinds of cell. Bacteria without NPs were as blank.
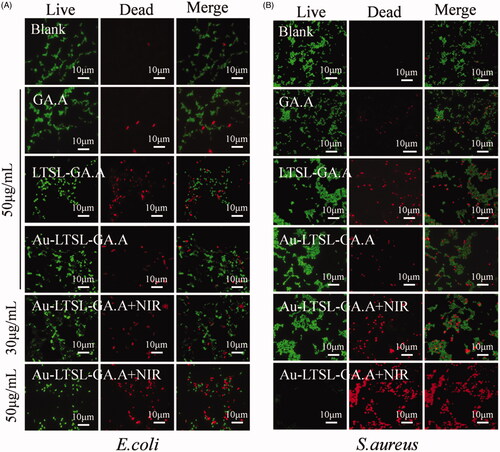
TABLE 1. MIC values (μg/mL) against drug-resistant E. coli and S. aureus.
Figure 4. The anticancer activity of Au-LTSL-GA.A evaluated through MTT (A) and RTCA (B) assay for MCF-7 cells. Cells treated with NIR irradiation, GA.A (30 μg/mL), LTSL-GA.A (30 μg/mL), Au NRs + NIR irradiation (30 μg/mL) and Au-LTSL-GA.A (30 μg/mL) were set as control groups. Cells were also treated with of Au-LTSL-GA.A (30 µg/mL) for 2 h in incubation and measured for 5 min upon irradiation (0.25 W/cm2). (C) The bright cell images of each of the above groups.
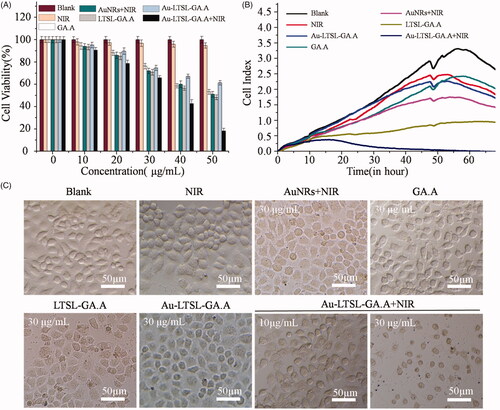
TABLE 2. IC50 (μg/mL) values of the GA.A, Au NRs + NIR irradiation, Au-LTSL-GA.A, and Au-LTSL-GA.A + NIR against cell lines.
Figure 5. Fluorescence microscopic images of MCF-7 cells incubated with different treatment and subsequent brief staining. The blank group was PBS. Cells treated with NIR irradiation, GA.A (30 μg/mL), Au NRs + NIR irradiation (30 μg/mL), Au-LTSL-GA.A (30 μg/mL) were set as control groups. Cells were treated with Au-LTSL-GA.A (30 μg/mL) for 2 h in incubation and measured for 5 min upon irradiation (0.25 W/cm2). Cells were stained (for 30 min) with Calcein-AM and PI for anticancer activity.
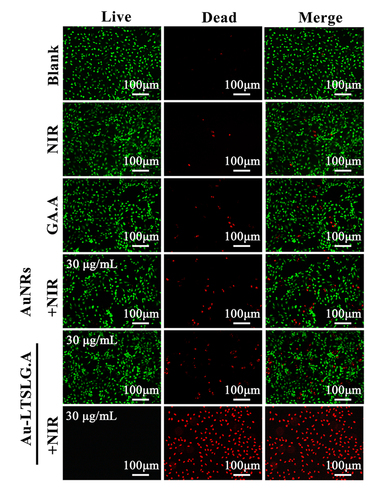
Figure 6. MCF-7 cells treated with Au-LTSL-GA.A (30 μg/mL) for 2 h in incubation and measured for 5 min upon irradiation (0.25 W/cm2), were analyzed using flow cytometry by Annexin V-FITC/PI staining after 12 h culture. Cells treated with NIR irradiation, GA.A (30 μg/mL), Au NRs + NIR irradiation (30 μg/mL) and Au-LTSL-GA.A (30 μg/mL) were set as control groups. The blank group was PBS.
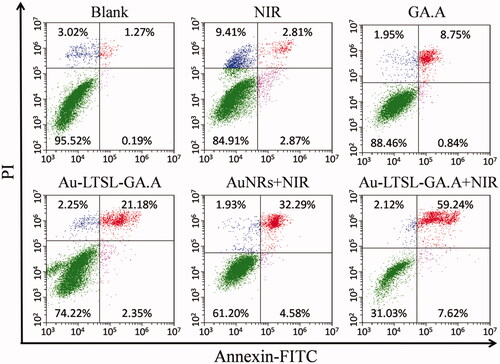
Figure 7. Morphological changes of drug-resistant E. coil (A) and S. aureus (B) through the SEM observed. Cells treated with Au-LTSL-GA.A (50 μg/mL) for 2 h incubation and measured for 5 min upon irradiation (0.25 W/cm2). Cells treated with GA.A (50 μg/mL), LTSL-GA.A (50 μg/mL), Au-LTSL-GA.A (50 μg/mL) were set as control groups. Bacteria without NPs were as blank. The sections in white circles will be enlarged.
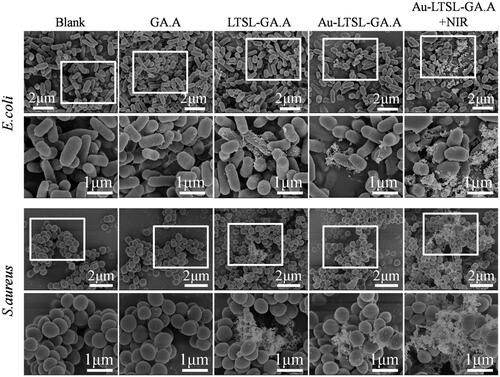
Figure 8. Morphological changes of drug-resistant E. coil (A) and S. aureus (B) through TEM observation. Cells treated with GA.A (50 μg/mL), LTSL-GA.A (50 μg/mL), Au-LTSL-GA.A (50 μg/mL) were set as control groups. Cells were treated with different concentration of Au-LTSL-GA.A (30 and 50 μg/mL) for 2 h in incubation and measured for 5 min upon irradiation (0.25 W/cm2). Bacteria without NPs were as blank. The red arrows point to the NPs.
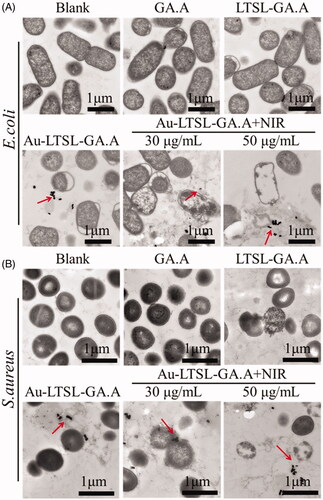
Figure 9. TEM images of MCF-7 cells treated with Au-LTSL-GA.A were analyzed at a concentration of 30 µg/mL measured for 5 min upon irradiation (0.25 W/cm2). Red squares and red arrows indicate Au-LTSL-GA.A. Assay treated with PBS is the blank. The GA.A (30 µg/mL) and LTSL-GA.A (30 µg/mL) were set as the control group.
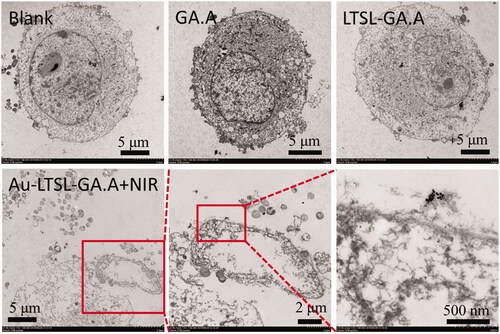
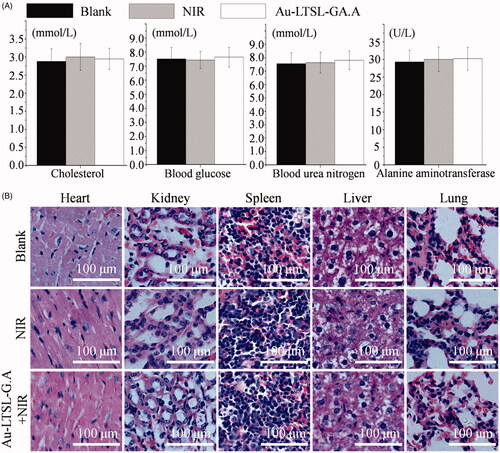
Figure 10. The potential in vivo toxicity evaluation. (A) Blood biochemistry data including liver function markers, kidney function markers, blood glucose, and blood lipids. (B) H&E-stained images of major organs. Each value represents the mean ± SD (n = 3).