Figures & data
Figure 1. Phagocytosis of (RB-NPs)-GP by M. tuberculosis infected J774 cells. Representative images of (A) untreated M. tuberculosis infected J774 cells, (B) M. tuberculosis infected cells exposed to 10 μg/ml blank GP and (C) to 10 μg/ml (RB-NPs)-GP, with magnified view of respective regions within yellow panels.
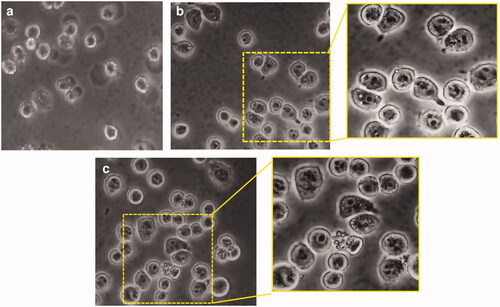
Figure 2. Free radical generation (A). ROS and (B) NO generation estimated by DCFH-DA mediated fluorescence observed within uninfected and M. tuberculosis infected macrophage after 24 h exposure to 10 μg/ml of (RB-NPs)-GP.
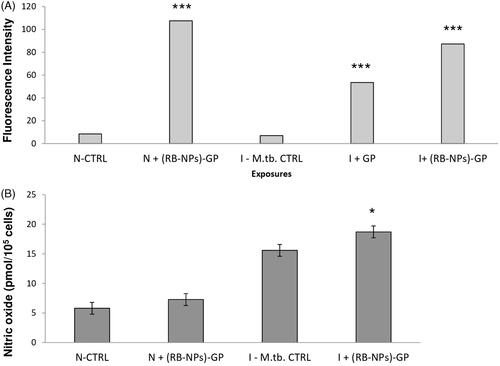
Figure 3. Acidic vesicular organelles (AVOs) and Lysosomal activity. (A) Microscopic detection of AVOs. Acridine orange stains nucleus and cytoplasm as green and AVOs as bright red. (a) M. tuberculosis H37Ra infected, untreated control cells (I-CTRL). (b) M. tuberculosis infected cells exposed to 10 μg/ml of blank GP for 24 h, or (c) to (RB-NPs)-GP. (B) Quantitative estimation of lysosomal activity within LysoTracker-G preloaded, M. tuberculosis infected macrophage after 24 h exposure to (RB-NPs)-GP.
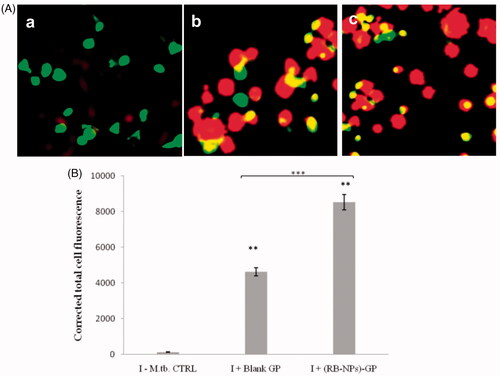
Figure 4. Cell death induction. (A) Analysis of changes in nuclear morphology. Photomicrographs showing nuclear morphology of J774.1 cells upon DAPI staining of (a) uninfected, untreated control cells, (b) after 24 h exposure of M. tuberculosis infected cells to 10 µg/ml and (c) 100 µg/ml of (RB-NPs)-GP. (RB-NPs)-GP treated cells showed nuclear disintegration and blebbing as indicated by arrows. (B) Quantitative analysis of cell death induction by (RB-NPs)-GP. Flow cytometric data on % apoptotic cells obtained upon PI staining after exposure of M. tuberculosis infected macrophage with 10 µg/ml of blank GP, soluble RB and (RB-NPs)-GP. (***p < 0.0001 as compared to Uninfected, untreated and infected, untreated controls).
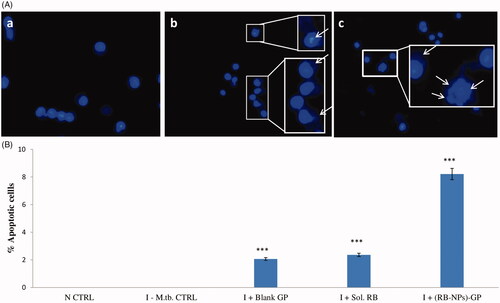
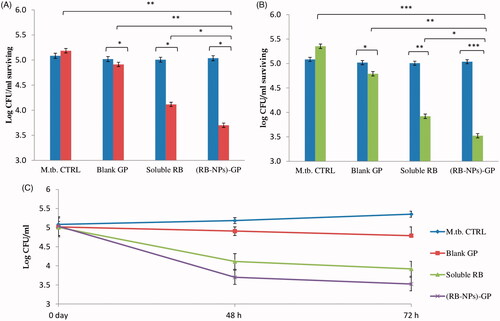
Figure 5. Intracellular anti-mycobacterial efficacy of (RB-NPs)-GP. Intracellular CFU counts upon exposure of M. tuberculosis infected cells to 10 µg/ml (RB-NPs)-GP for A. 48 h (grey bars) and B. 72 h (black bars) and comparing it with that at 0 h exposure time point (white bars), and with cells exposed to equivalent concentrations of blank GP and pure, soluble RB. M.tb. CTRL indicates control, untreated cells. C. Growth curve of surviving M. tuberculosis in J774 macrophage exposed to 10 µg/ml of (RB-NPs)-GP, or blank GP or free RB up to 72 h post-infection. (*p < 0.05; **< 0.001; ***< 0.0001 as compared to untreated cells, Student’s t-test).