Figures & data
Figure 1. Scanning electron micrograph of Zn/Al-LDH nanoparticles that layered structure of Zn/Al-LDH nanoparticles was obvious.
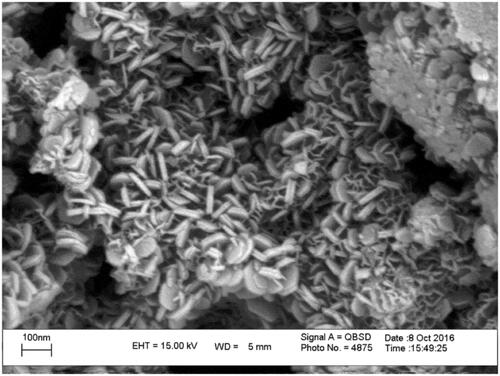
Figure 2. Powder XRD patterns of (a) Zn/Al diffraction peaks distinctive of an LDH structure), (b) VP- Zn/Al-LDH, and (c) MD-Zn/Al-LDH.
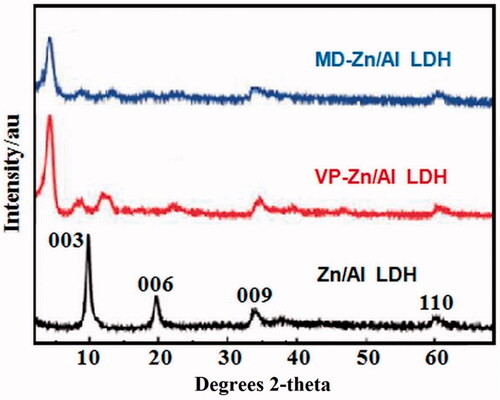
Figure 3. FT-IR spectra for (a), Zn/Al-LDH, (b) VP- Zn/Al-LDH, and (c) MD-Zn/Al-LDH.
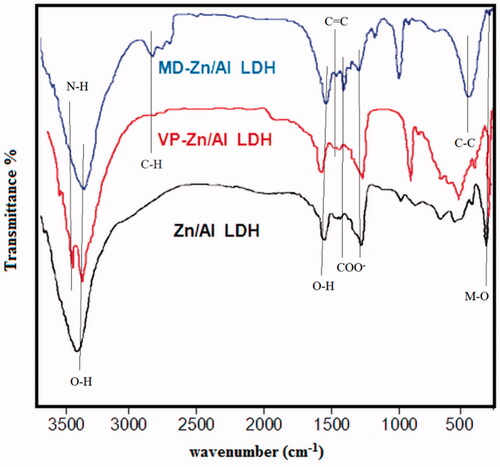
Figure 4. The result of MTT assay (a) for comparison between the particles with size of (5–10) nm, (50–100) nm, and (200–300) nm, in tow difference amount of nanoparticle consisting of 0.001 g and 0.005 g, (b) for antibacterial activity. The bacterial proliferation approximately decreases 30–40% in growth rate compared to that of the control cells.
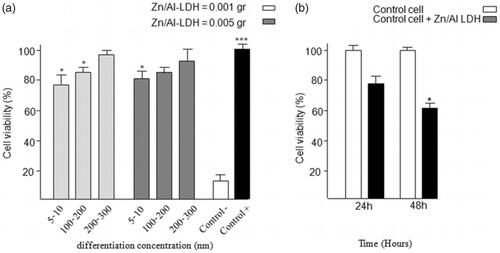
Figure 5. Correctness of the drug loaded by drug release in the phosphate buffer (pH = 7.4) solution and absorption via UV-Vis Spectrophotometer in specified intervals.
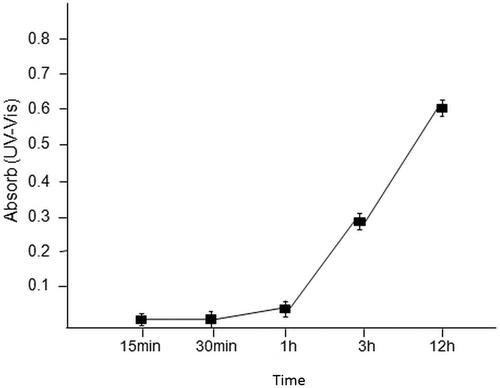
Figure 6. (a) UV-Vis spectrum of valproate and methyldopa release in intervals of 15 min, 30 min, 1h, 3h and 12 h in wavelength of 250 nm for valproate (VP) and 280 nm for methyldopa (MD) by co- operation method; (b) UV- Vis spectrum of valproate and methyldopa release in intervals of 15 min, 30 min, 1h, 3h and 12 h in wavelength of 250 nm for valproate (VP) and 280 nm for methyldopa (MD) by ion exchange method.
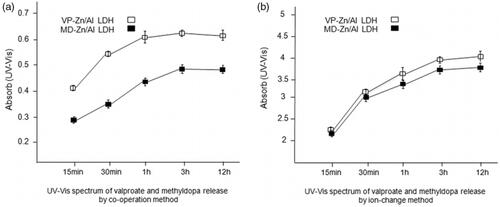
Figure 7. Zn/Al-LDH nanoparticles take up pCEP4/Cdk9 gene (a) Association/intercalation of pCEP4/Cdk9 with/in Zn/Al-LDH nanoparticles; Ladder, pCEP4/Cdk9-Zn/Al-LDH, and pCEP4/Cdk9 alone respectively. (b) Absorption in wavelength of 260 nm before and after loaded pCEP4/Cdk9 gene with/in Zn/Al-LDH.
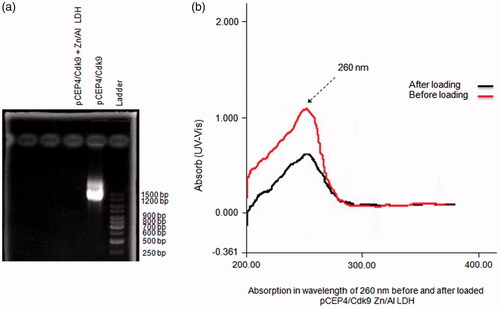
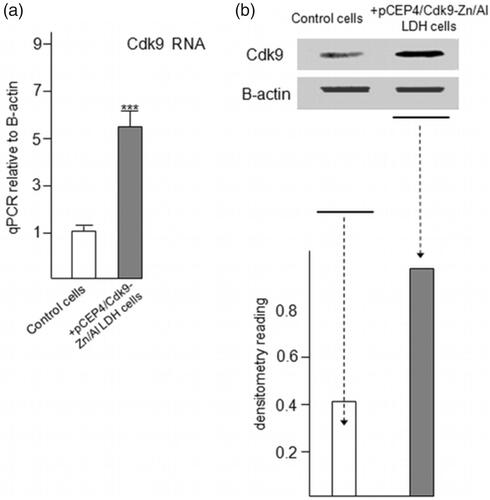
Figure 8. Increased expression of Cdk9 in C2C12 cells followed by taking up and releasing of pCEP4/Cdk9 gene with/in Zn/Al-LDH nanoparticle. (a) Increased Cdk9 expression in transfected C2C12 cells was analyzed by quantitative Real-Time PCR assay (n = 6). (c) Cdk9 protein level in transfected and control cells was examined by Western blot analysis. (d) Data are expressed as mean ± SEM ***p < .001