Figures & data
Figure 1. Analysis of absorption spectra of AuNPs by characterization using UV-Visible spectroscopy.
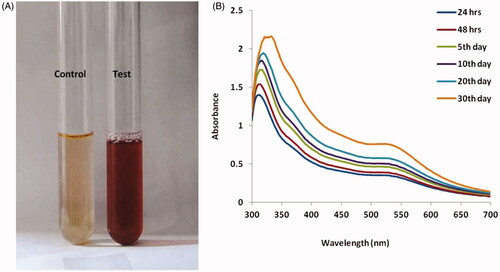
Figure 2. XRD and DLS pattern of AuNPs synthesised from Abies spectabilis.
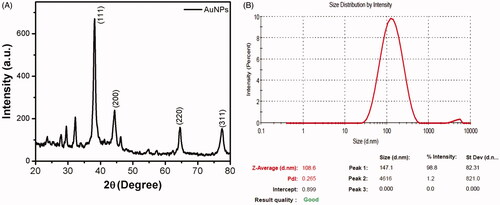
Figure 3. TEM-SAED pattern of AuNPs synthesised from A. spectabilis.
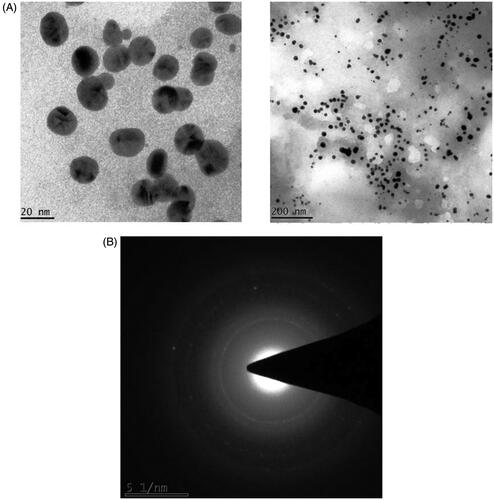
Figure 4. Elemental analysis of AuNPs using EDX.
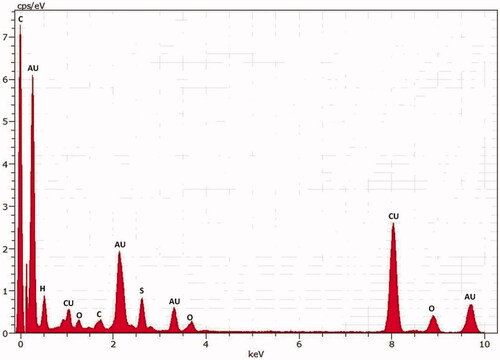
Figure 5. Fourier-transform infrared spectroscopy analysis of gold nanoparticles synthesised from A. spectabilis.
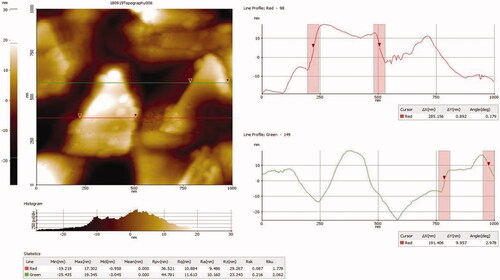
Figure 6. AFM of AuNPs synthesised from A. spectabilis.
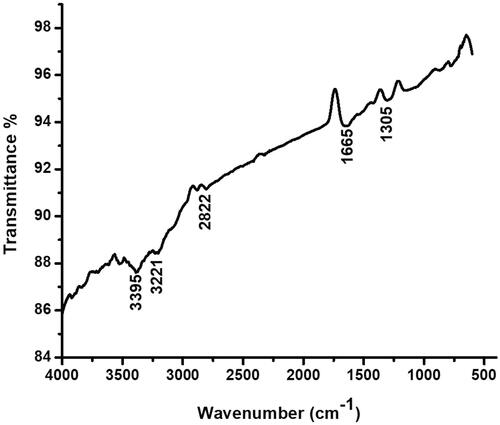
Figure 7. Cytotoxicity effect of AuNPs from A. spectabilis. Values are expressed as the mean ± SD (n = 3). Significant at *p < .05; compared with untreated control cells.
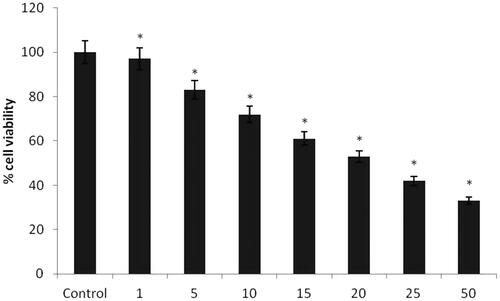
Figure 8. The Effect of AuNPs treatment on induction of apoptosis in bladder cancer cells.
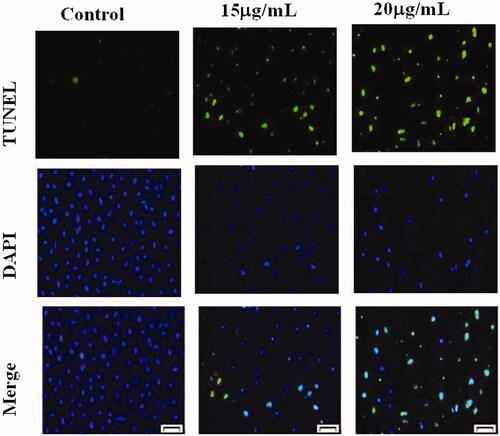
Figure 9. ROS generation by AuNPs from A. spectabilis. Values are expressed as the mean ± SD (n = 3). Significant at *p < .05; compared with untreated control cells.
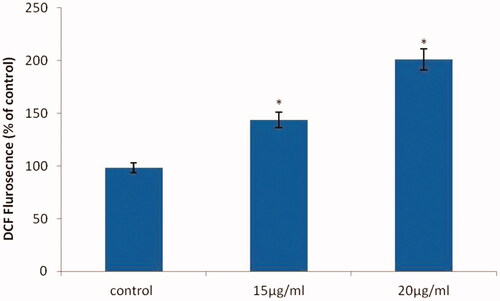
Figure 10. Effect of AuNPs from A. spectabilis on cell migration in T24 cell lines.
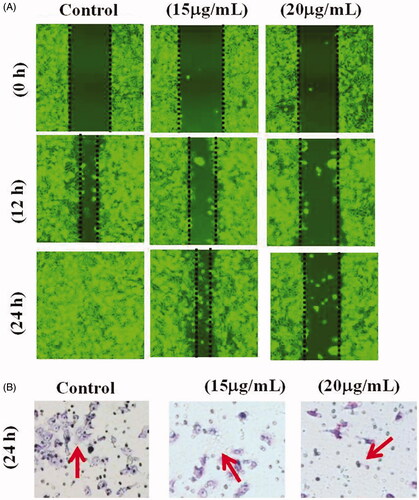
Figure 11. Effect of AuNPs from A. spectabilis of caspase-3 and 9 activity. Values are expressed as the mean ± SD (n = 3). Significant at *p < .05; compared with untreated control cells.
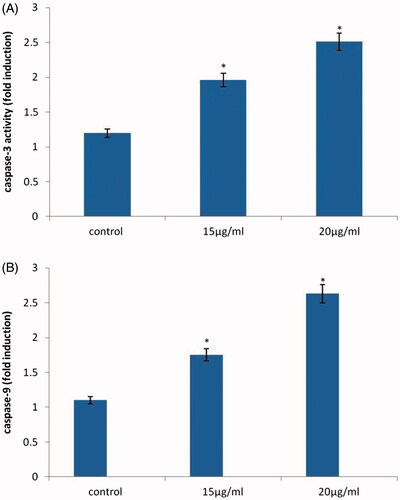
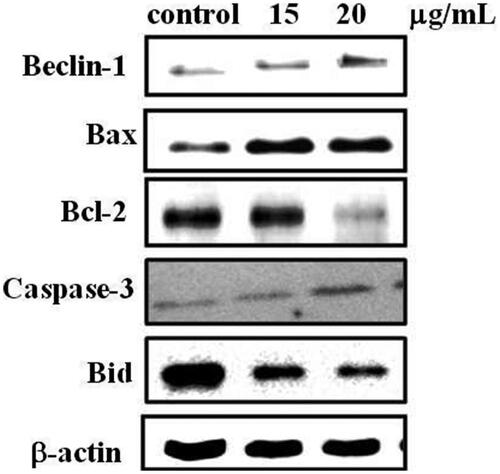
Figure 12. Modulation of pro and anti-apoptotic protein expressions after AuNPs treatment.