
Figures & data
Table 1. A Summary of some polymeric nanoparticles prepared by several techniques to deliver APIs/proteins.
Figure 1. Classification of most commonly used nanocarriers for drug delivery.
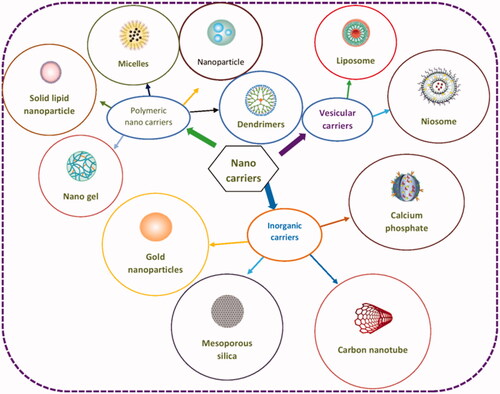
Table 2. Overview of current state of development of drugs using nanotechnology.
Figure 2. Schematic depiction of various steps involved in the preparation of Solid Lipid nanoparticles by hot homogenization technique.
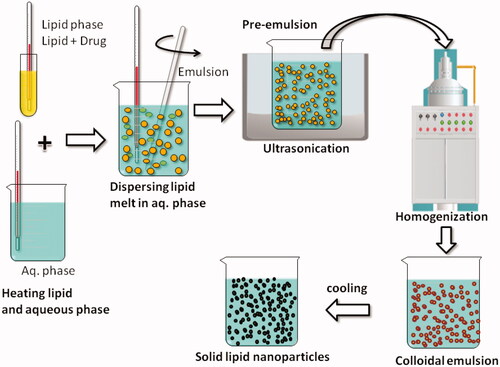
Figure 3. Schematic showing the instrumentation of Dynamic Light Scattering (DLS).
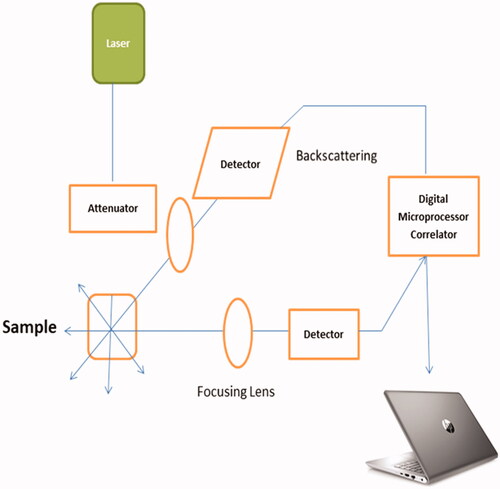
Figure 4. SEM image of insulin containing starch nanoparticles.
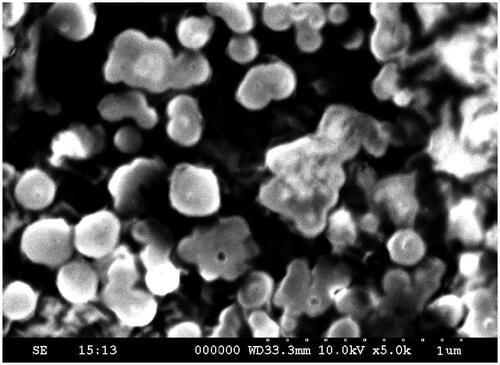
Figure 5. Image indicating the Electrical Double Layer on a negatively charged particle. Right on above the particle surface there is a strongly bounded layer (Stern layer) containing opposite charge ions (positive ions). Further than Stern layer another diffuse layer deposits develops containing of both negative and positive charges. During electrophoresis study, the particle with bounded Electrical Double Layer moves towards the electrodes with the slipping plane becoming the interface between the mobile particles and dispersant. The ZP is the electrokinetic potential at this slipping plane.
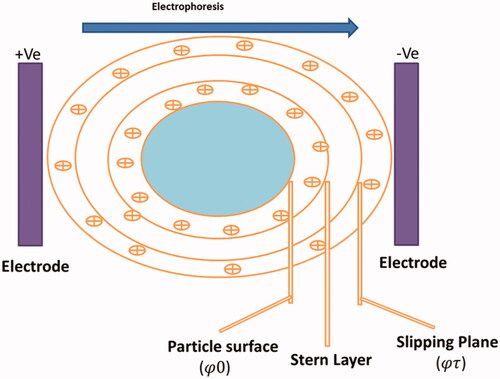
Figure 6. Schematic representation of the thermal characterization instruments: (a) DTA, and (b) DSC. Reproduced with kind permission from Taylor and Francis [Citation66].
![Figure 6. Schematic representation of the thermal characterization instruments: (a) DTA, and (b) DSC. Reproduced with kind permission from Taylor and Francis [Citation66].](/cms/asset/72cabfa0-fdeb-40b8-b2b6-cb7780e2dc88/ianb_a_1561457_f0006_c.jpg)
Figure 7. Confocal images of CHo cells treated with different ptx concentrations for 12 h. (A) Negative control; (B) ptx at 50 ng/ml; (C) ptx at 100 ng/ ml; D: ptx at 200 ng/ml, to exhibit the effect of ptx concentration on toxin translocation (ptx at 20 ng/ml). Green fluorescence represents ptx, blue fluorescence represents nucleus, and red fluorescence represents F-actin of cytoskeleton. Scale bar = 20 μm. Reproduced with kind permission from Taylor and Francis [Citation54].
![Figure 7. Confocal images of CHo cells treated with different ptx concentrations for 12 h. (A) Negative control; (B) ptx at 50 ng/ml; (C) ptx at 100 ng/ ml; D: ptx at 200 ng/ml, to exhibit the effect of ptx concentration on toxin translocation (ptx at 20 ng/ml). Green fluorescence represents ptx, blue fluorescence represents nucleus, and red fluorescence represents F-actin of cytoskeleton. Scale bar = 20 μm. Reproduced with kind permission from Taylor and Francis [Citation54].](/cms/asset/5c868020-9ff8-4904-9b49-8b5445f1e1ff/ianb_a_1561457_f0007_c.jpg)