Figures & data
Scheme 1. A schematic illustration of the preparation procedure of PEG passivated carbon dots (CDs-PEG) through microwave carbonization.
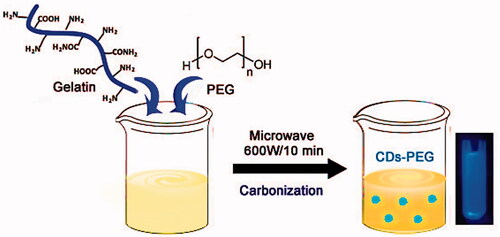
Figure 1. Fourier transform infrared spectroscopy (FTIR) of the PEG passivated carbon dots (CDs-PEG), MTX loaded CDs-PEG (MTX/CDs-PEG) and free methotrexate (MTX) (a) and X-ray diffraction (XRD) pattern of the CDs-PEG (b).
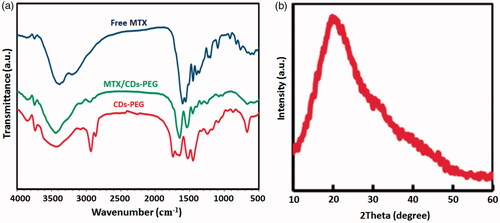
Figure 2. Transmission electron microscopy (TEM) images (inset shows the size distribution) (a,b) and Zeta potential of the CDs-PEG (c).
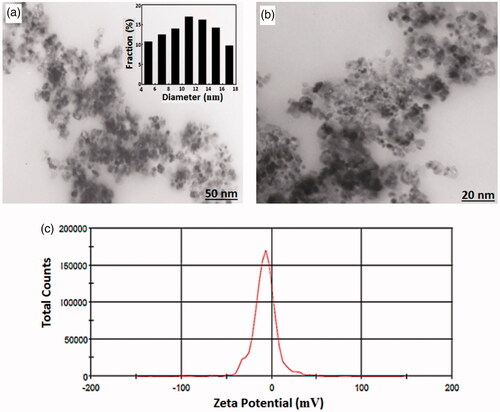
Figure 3. UV–vis absorption spectra and excitation-dependent photoluminescence (PL) spectra of the PEG passivated carbon dots (CDs-PEG) (a) and the PL spectra of the CDs with and without the adding of PEG (b).
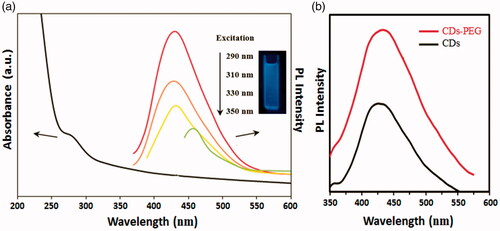
Figure 4. UV–vis absorption spectra of methotrexate (MTX) and MTX loaded PEG passivated carbon dots (MTX/CDs-PEG) (a) and cumulative in vitro release profiles of MTX from MTX/CDs-PEG (data are presented as mean ± standard deviation, n = 3) (b).
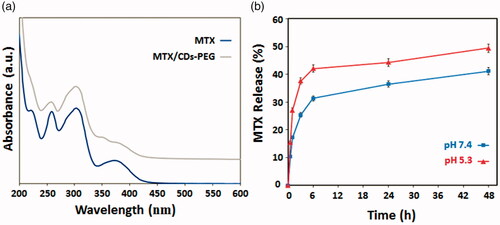
Figure 5. The cell viability study of human breast epithelial adenocarcinoma (MCF-7) cell after incubation of methotrexate (MTX), PEG passivated carbon dots (CDs-PEG) and MTX loaded CDs-PEG (MTX/CDs-PEG) at various concentrations (µg/mL) for 24 and 48 h.
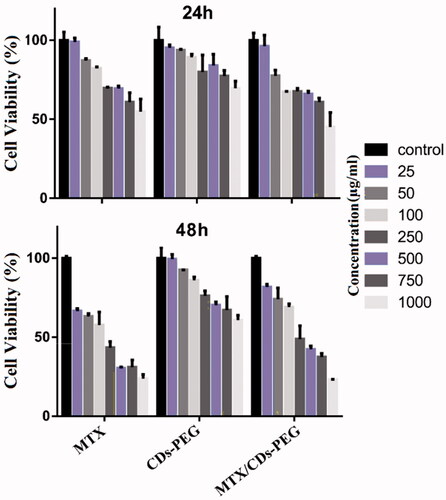
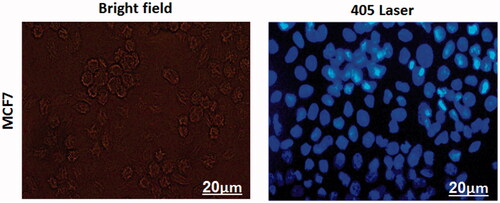
Figure 6. Fluorescence microscopy images of treated human breast epithelial adenocarcinoma (MCF-7) cells with the methotrexate (MTX) loaded developed nanocarrier under bright field and 405 nm excitation after 3 h (scale bar = 20 μm).
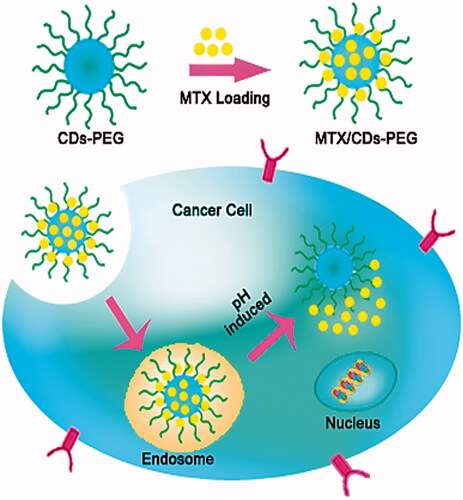
Scheme 2. Cell uptake mechanism and capabilities of developed nanocarrier for passive and active methotrexate (MTX) delivery to the cancerous tissue by human breast epithelial adenocarcinoma (MCF-7) cells.