
Figures & data
Figure 1. Expression levels of miR-429 in thyroid cancer tissues and cell lines. (A) Expression of miR-429 in 59 thyroid cancer tissue samples and matched nontumourous tissues. (B) Expression of miR-429 in normal thyroid cell line and two thyroid cancer cell lines. ***p < .001.
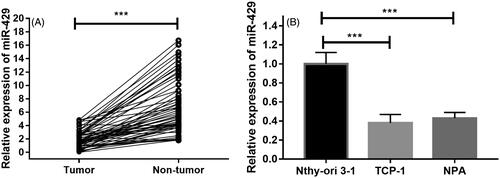
Figure 2. Overexpression of miR-429 inhibits thyroid cancer cell proliferation. (A) The growth curve of TCP cells after miR-429 precursor transfection compared to miRNA control. (A) The growth curve of NPA cells after miR-429 precursor transfection compared to miRNA control. *p < .05, p < .01 and p < .001.
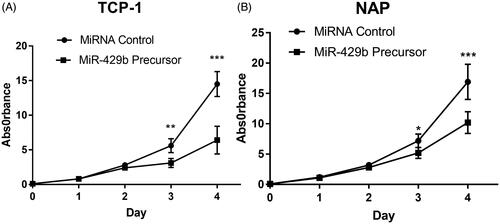
Figure 3. Overexpression of miR-429 induces apoptosis in thyroid cancer cell lines. (A) Overexpression of miR-429 affects apoptosis status in TCP-1. (B) Overexpression of miR-429 affects apoptosis status in NPA. (C) The distribution of apoptosis in both TCP-1 and NPA cell lines.
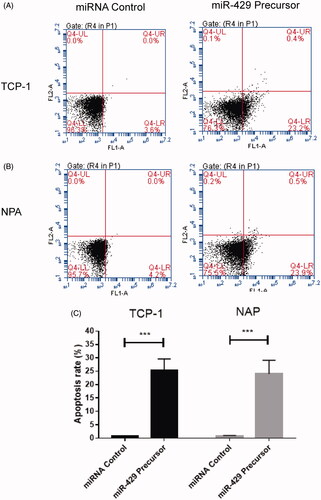
Figure 4. Influence of miR-429 on cell migration and invasion in thyroid cancer cell lines. (A) Effects of miR-429 on cell migration and invasion in TCP-1 and NPA cell lines. (B) Effects of miR-429 on cell invasion in TCP-1 and NPA cell lines. ***p < .001.
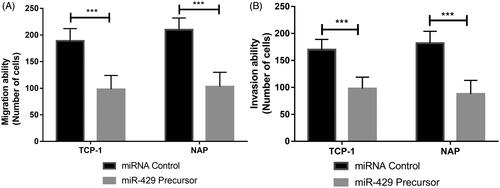
Figure 5. ZEB1 is a direct target of miR-429. (A) The binding site for miR-429 in the 3’-UTR of ZEB1 mRNA. (B) The relative luciferase activity is measured in each cell group after co-transfection with either miR-429 or miRNA controls. ***p < .001.
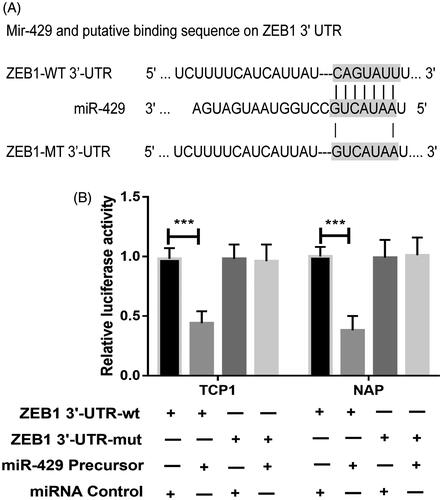
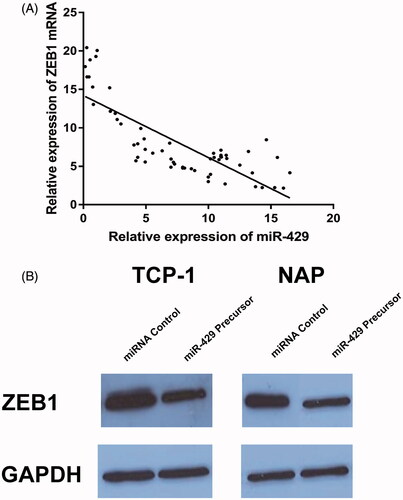
Figure 6. MiR-429 directly regulated ZEB1. (A) The expression of miR-429 is inversely correlated with ZEB1 mRNA. (B) Western blot analysis of ZEB1 expression in the miR-429 and miRNA control groups in TCP-1 and NPA cell lines.
Availability of data and materials
The datasets used and/or analysed during this study are available from the corresponding author on reasonable request.