Figures & data
Table 1. Primers of miRNAs used for quantitative real-time polymerase chain reaction (qRT-PCR).
Table 2. Primers of genes used for quantitative real-time polymerase chain reaction (qRT-PCR).
Figure 1. The inhibition ratio of oxaliplatin-resistant colorectal cancer cells HCT116/L and the parental cell line HCT116 after treated with different concentrations of oxaliplatin for 24h using the drug sensitivity assay. ****p < .0001 (Student’s t-test).
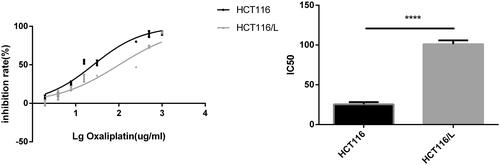
Figure 2. Identification of differentially expressed miRNAs and genes in HCT116 and HCT116/L. (a). Clustering maps of differentially expressed miRNAs (left)/genes (right) seated across three HCT116 and three HCT116/L samples. Columns represent different samples, and rows represent different miRNAs/genes. Red indicates high expression of miRNAs/genes, and green indicates low expression of miRNAs/genes. (b). Volcano plot of differentially expressed miRNAs (left)/genes (right), where each dot represents a miRNA/gene. Upregulated and downregulated miRNAs/genes are shown as red and green dots, respectively, while the blue and black dots represent those miRNAs/genes whose expressions are not significantly different between HCT116 and HCT116/L cells. The x-axis indicates the difference of the identified miRNA/gene level, while the y-axis shows the significance of the miRNA/gene level. Fold change (FC) is a ratio of the expression of two samples and false discovery rate (FDR) is the adjusted p values using the Benjamini and Hochberg approach. Differentially expressed miRNAs and genes were identified by an FC greater than two-fold and an FDR less than 0.05. (c/d). Small RNA-Seq/RNA-Seq data and qRT-PCR validation of selected differentially expressed miRNAs/genes. Log2 FC/RQ is the logarithm of the fold change or relative quantity to base 2. Error bars represent the standard deviation (STDEV) of the qRT-PCR analysis (n = 3).
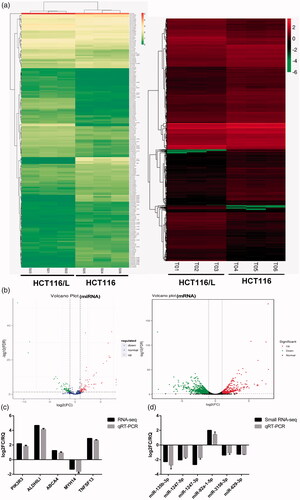
Table 3. Expression of 13 differentially expressed candidate miRNAs in colorectal cancer cells.
Figure 3. Overexpression of miR-483-3p restored oxaliplatin responsiveness in HCT116/L cells. (a). qRT-PCR analysis was performed for miR-483-3p, which was differentially expressed between HCT116 and HCT116/L cells. The expression level of miR-483-3p was normalized to the level in HCT116 cells. (b). The expression level of miR-483-3p in HCT116/L transfected with different concentrations (20 μM, 30 μM and 40 μM) of miR-483-3p mimics. (c). The drug sensitivity of the HCT116/L cells transfected with negative control (NC) or miR-483-3p mimics. The IC50 of oxaliplatin in transfected HCT116/L cells was calculated from the inhibition curves. Each experiment was performed in triplicate. (d). The effect of overexpression of miR-483-3p on the migration using cell migration assay of HCT116/L cells. (e). Overexpression of miR-483-3p in HCT116/L cells increased the apoptosis rate. Various concentrations of oxaliplatin resulted in differences in the cell apoptosis rate. The data were presented mean ± SD of three independent experiments. *p < .05, **p < .01, ***p < .001 and ****p < .0001(Student’s t-test).
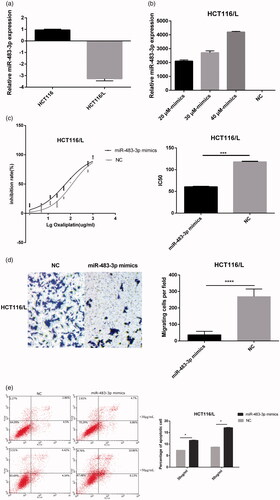
Figure 4. Downexpression of miR-483-3p enhanced the resistance of HCT116 to oxaliplatin treatment. (a). The expression level of miR-483-3p in HCT116 transfected with different concentrations (20 μM, 30 μM and 40 μM) of miR-483-3p inhibitor. (b). Inhibition of miR-483-3p induced by transfection of miR-483-3p inhibitor enhanced the resistance of HCT116 cells to oxaliplatin at 24 h post treatment. (c). Inhibition of miR-483-3p in HCT116 cells decreased the apoptosis rate. *p < .05 and ***p < .001 (Student’s t-test).
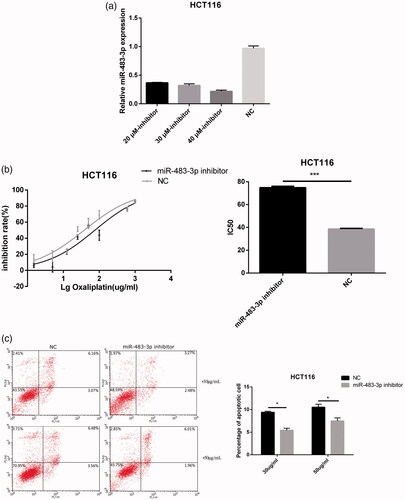
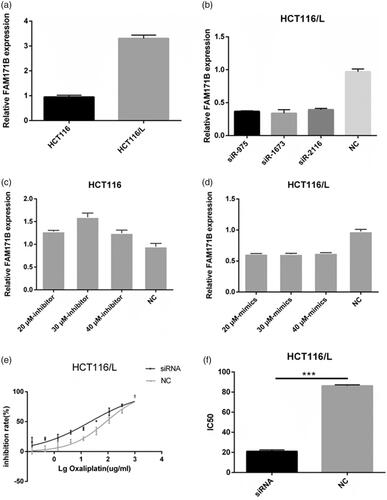
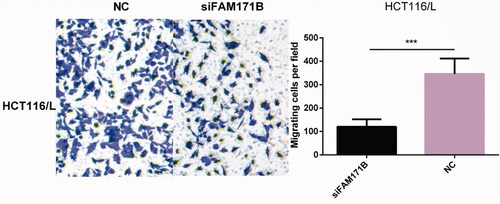
Figure 6. Effect of FAM171B knockdown on cell migration in HCT116/L. In vitro migration assay showed that knockdown of FAM171B weakened HCT116/L cell migration. ***p < .001 (Student’s t-test).