Figures & data
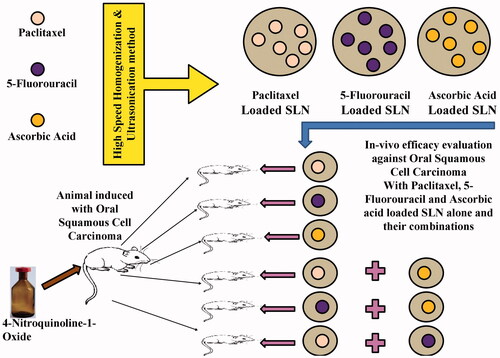
Table 1. Different composition of SLN formulation.
Table 2. In-vivo experimental design.
Table 3. Physicochemical evaluation of solid lipid nanoparticles.
Figure 1. Scanning Electron Micrograph of SLNs.
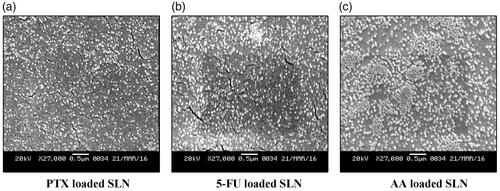
Figure 2. Transmission Electron Micrograph of SLNs.
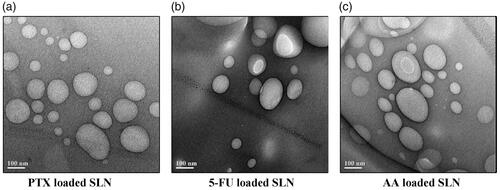
Table 4. Release kinetics of SLN.
Figure 3. Fourier transform infrared (FTIR) spectra of (a) PTX loaded SLN, (b) Fourier transform infrared (FTIR) spectra of 5-FU loaded SLN, (c) Fourier transform infrared (FTIR) spectra of AA loaded SLN.
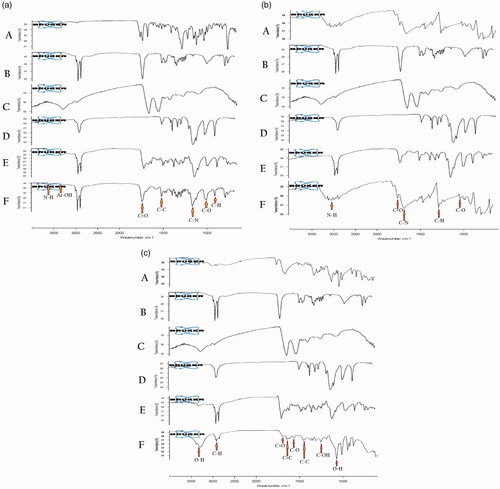
Figure 4. Differential scanning calorimetry thermograms of (a) PTX loaded SLN, (b) Differential scanning calorimetry thermograms of 5-FU loaded SLN, (c) Differential scanning calorimetry thermograms of AA loaded SLN.
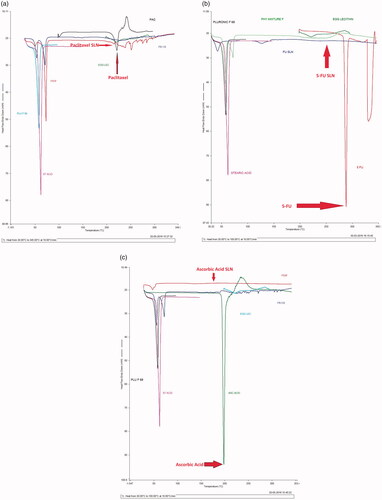
Table 5. Results of stability studies of SLN.
Figure 5. Histological changes in the mice tongue tissue after two weeks of treatment period.
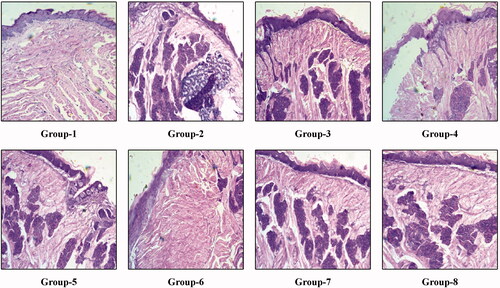
Figure 6. Histological changes in the mice tongue tissue after four weeks of treatment period.
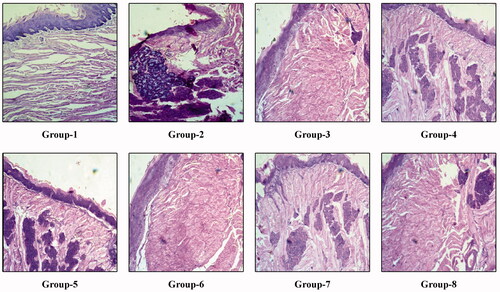
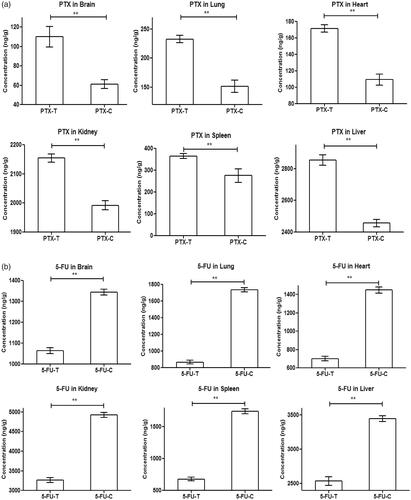
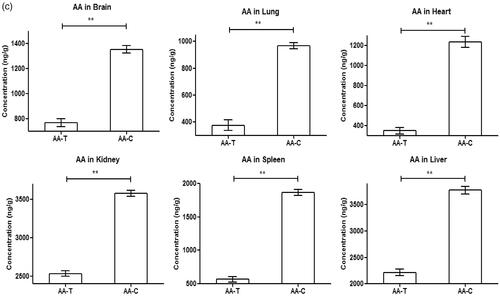
Figure 7. Pharmacokinetic profile of (a) PTX loaded SLN, (b) Pharmacokinetic profile of 5-FU loaded SLN, (c) Pharmacokinetic profile of AA loaded SLN.
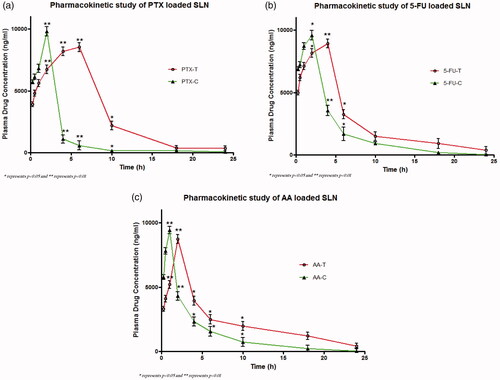
Table 6. Results of pharmacokinetic studies of SLN.