Figures & data
Figure 1. Neurokinin 1 receptor (NK-1R) is expressed in human fibroblast-like synoviocytes (FLSs). We applied the human glioblastoma cell line U251 as a positive control. (a). RT-PCR results indicate that NK-1R is expressed in human FLSs at the gene level; (b). Western blot results indicate that NK-1R is expressed in human FLSs at the protein level.
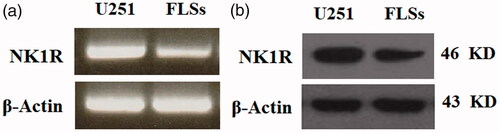
Figure 2. Expression of neurokinin 1 receptor (NK-1R) is increased in rheumatoid arthritis (RA)-FLSs as compared to normal FLSs. (a). Real-time PCR analysis of NK-1R; (b). Western blot analysis of NK-1R (*, p < .01 vs. vehicle group).
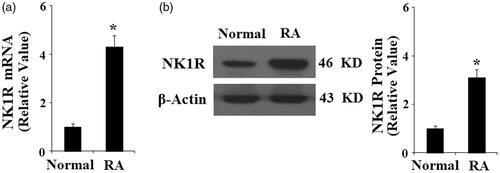
Figure 3. Expression of neurokinin 1 receptor (NK-1R) is increased in normal FLSs in response to TNF-α treatment (5, 10, 20 ng/ml) in a concentration-dependent manner. (a) Expression of NK-1R at the gene level was determined by real-time PCR analysis; (b). Expression of NK-1R at the protein level was determined by Western blot analysis (*, #, $, p < .01 vs. previous column group).
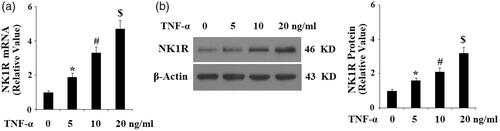
Figure 4. The neurokinin-1 receptor (NK-1R) antagonist aprepitant ameliorates TNF-α-induced reactive oxygen species (ROS) production and NOX-4 expression in FLSs. FLSs were incubated with 10 ng/ml TNF-α in the presence or absence of aprepitant (5, 10 μM) for 24 h. (a). ROS generation was determined by DCFH-DA assay; Scale bars, 100 μm; (b). NOX-4 expression was determined by Western blot analysis (*, #, $, p < .01 vs. previous column group).
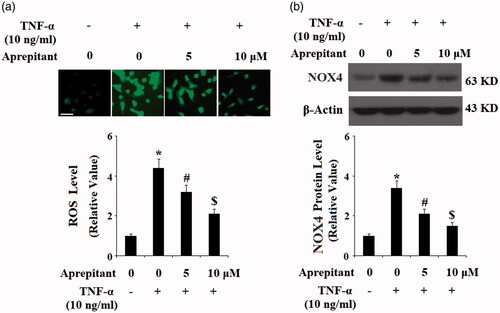
Figure 5. The neurokinin-1 receptor (NK-1R) antagonist aprepitant inhibits TNF-α (10 ng/ml)-induced expression of IL-1β, IL-6, IL-8 in FLSs. FLSs were incubated with 10 ng/ml TNF-α in the presence or absence of aprepitant (5, 10 μM) for 24 h. (a). mRNA expression of IL-1β, IL-6, and IL-8 determined by real-time PCR; (b). Secretion of IL-1β, IL-6 and IL-8 determined by ELISA (*, #, $, p<.01 vs. previous column group).
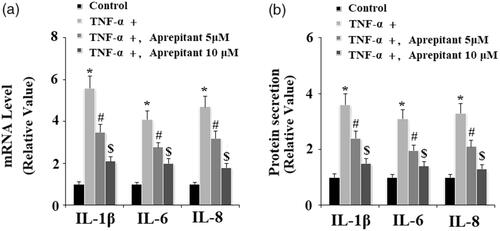
Figure 6. The neurokinin-1 receptor (NK-1R) antagonist aprepitant inhibits TNF-α (10 ng/ml)-induced expression of MMP-3 and MMP-13 in FLSs. FLSs were incubated with 10 ng/ml TNF-α in the presence or absence of aprepitant (5, 10 μM) for 24 h. (a). mRNA expression of MMP-3 and MMP-13 determined by real-time PCR; (b). Protein expression of MMP-3 and MMP-13 determined by ELISA (*, #, $, p < .01 vs. previous column group).
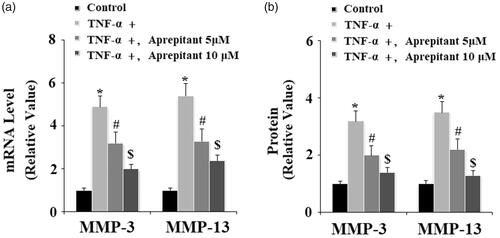
Figure 7. The neurokinin-1 receptor (NK-1R) antagonist aprepitant inhibits TNF-α (10 ng/ml)-induced expression of p-IκBα and IκBα degradation in FLSs. FLSs were incubated with 10 ng/ml TNF-α in the presence or absence of aprepitant (5, 10 μM) for 6 h. Western blot analysis showing amounts of p-IκBα and IκBα in FLSs (*, #, $, p<.01 vs. previous column group).
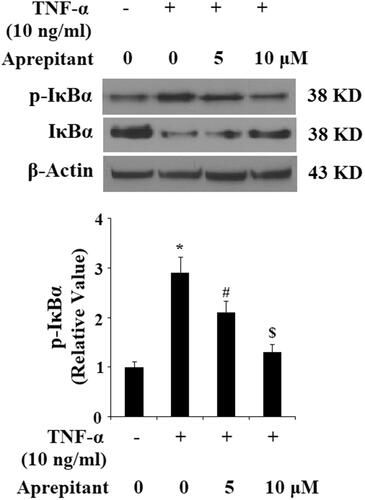
Figure 8. The neurokinin-1 receptor (NK-1R) antagonist aprepitant inhibits TNF-α (10 ng/ml)-induced nuclear translocation of p65 and luciferase activity of NF-κB. (a) Nuclear levels of p65 was determined by Western blot analysis with lamin B as a positive control; (b) Luciferase reporter assay results reveal that NF-κB activity was attenuated by treatment with aprepitant (*, #, $, p < .01 vs. previous column group).
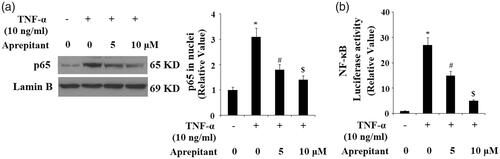
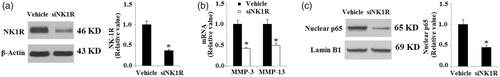
Figure 9. Silencing of NK-1R ameliorates the inflammatory response in RA-FLSs. RA-FLSs were infected with NK-1R lentiviral shRNA for 24 h. (a). Western blot analysis revealed successful knockdown of NK-1R; (b). Expression of MMP-3 and MMP-13 at the gene level determined by real-time PCR analysis; (c). Nuclear translocation of NK-1R determined by Western blot analysis (*, p < .01 vs. vehicle control).