Figures & data
Figure 1. IR spectra of (a) HAP, (b) PXSA, (c) HAP/PXSA and (d) HAP/PXSA/VK.
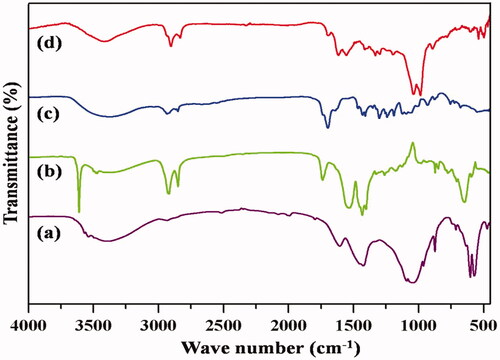
Figure 2. XRD spectra of (a) HAP, (b) PXSA, (c) HAP/PXSA and (d) HAP/PXSA/VK.
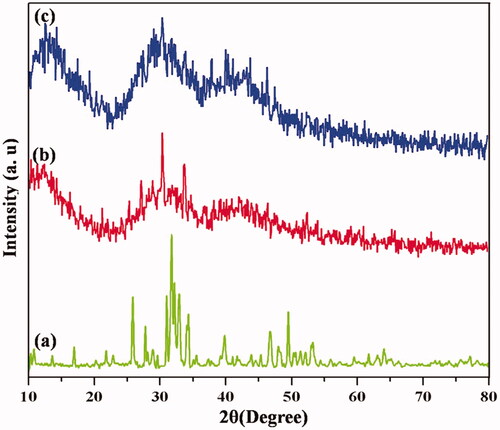
Figure 3. SEM images of (a) HAP, (b) PXSA, (c) HAP/PXSA and (d) HAP/PXSA/VK, TEM images of (e) PXSA, (f) HAP/PXSA, EDAX spectrum and SAED image of (g and h) HAP/PXSA.
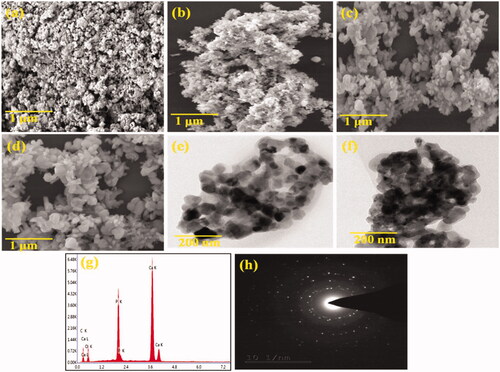
Figure 4. Biodegradation studies of HAP/PXSA and HAP/PXSA/VK composites.
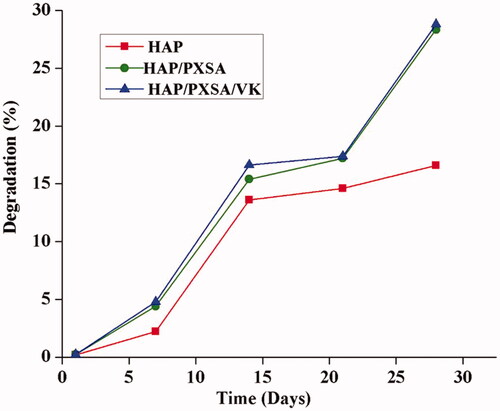
Figure 5. UV–Vis spectra of (a) encapsulation efficiency of VK on HAP/PXSA, (b) release of VK from HAP/PXSA/VK, and (c) VK release profile from HAP/PSXA/VK.
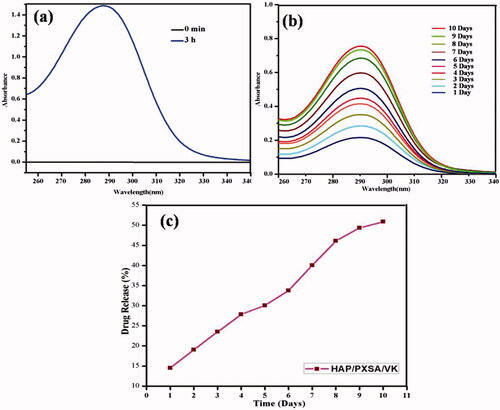
Figure 6. SEM images of HAP/PXSA/VK in SBF immersed on (a) 1 d, (b) 3 d and (c) 7 d.
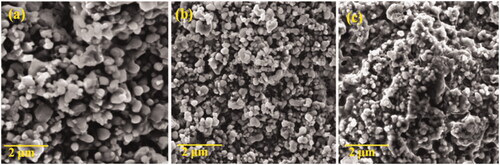
Figure 7. Concentrations of ALP produced by MSCs post differentiation by various biomaterials at days 5, 10 and 15.
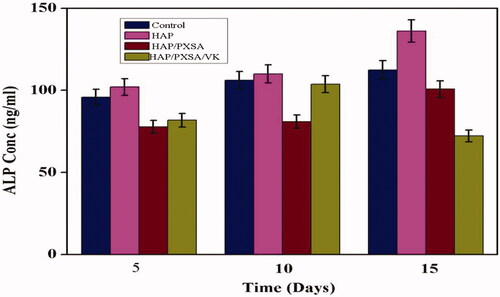
Figure 8. Cell viability of MSCs differentiated by osteogenic differentiation media with biomaterials at days 5, 10 and 15.
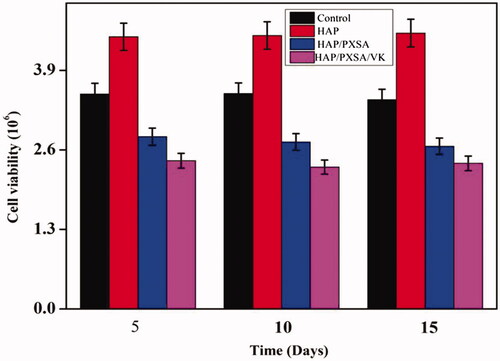
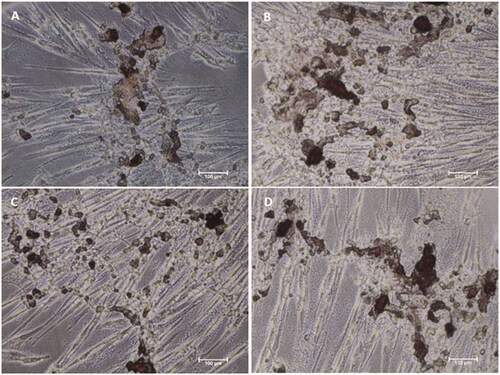
Figure 9. Alizarin Red S staining of MSCs differentiated by biomaterials at day 10. Microscopic images of MSCs after differentiation by (A) Osteo MAX-XF differentiation medium only, (B) Osteo MAX-XF differentiation medium and HAP, (C) OsteoMAX-XF differentiation medium and HAP/PXSA and (D) Osteo MAX-XF differentiation medium and HAP/PXSA/VK.
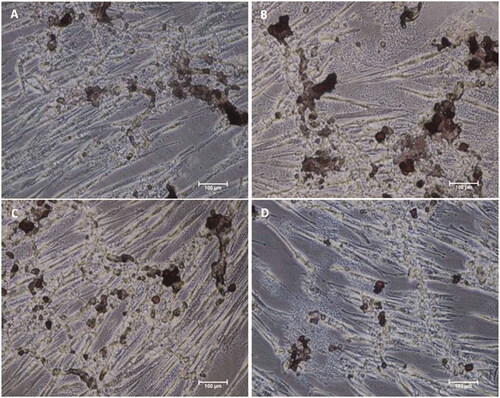
Figure 10. Alizarin Red S staining of MSCs differentiated by biomaterials at day 15. Microscopy images of MSCs after differentiation by (A) Osteo MAX-XF differentiation medium only; (B) Osteo MAX-XF differentiation medium and HAP. The image showed high numbers of attached MSCs on the well, indicating high cell viability; (C) Osteo MAX-XF differentiation medium and HAP/PXSA; (D) Osteo MAX-XF differentiation medium and HAP/PXSA/VK.