Figures & data
Figure 1. Molecular structure of NGR1.
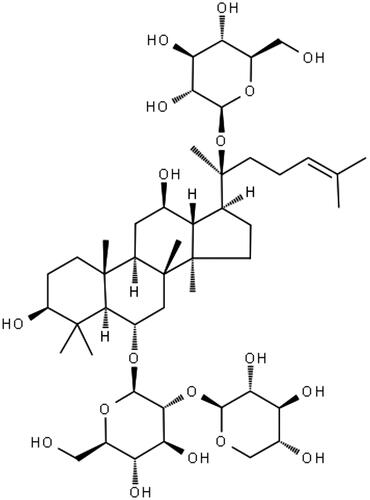
Figure 2. NGR1 promoted MC3T3-E1 cells differentiation in a dose-dependent manner. (A) The expression of Runx-2 was elevated by NGR1 at protein levels. (B) The expression of Osx was increased in MC3T3-E1 cells pre-treated with NGR1. (C) ALP activity was enhanced by NGR1. MC3T3-E1 cells were pre-treated with NGR1 (0–50 μmol/L) for 48 h. NGR1: Notoginsenoside R1; Osx: Osterix; ALP: alkaline phosphatase. *p < .05, **p < .01, or ***p < .001 compared to control.
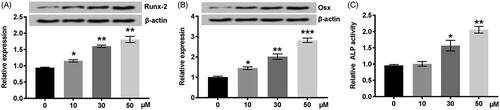
Figure 3. Runx-2, Osx, and ALP activity were enhanced by NGR1 by improving phosphorylation of MAPK, JAK, and STAT3.(A) The phosphorylated expression of MAPK, JAK1, and STAT3 was increased in preosteoblast MC3T3-E1 cells treated with NGR1. (B) SB and RU repressed the phosphorylation of MAPK, JAK1 and STAT3, respectively. (C) SB and RU decreased the protein expression of Runx-2 induced by NGR1. (D) SB and RU inhibited the protein expression of Osx induced by NGR1. (E) SB and RU inactivated ALP activity elevated by NGR1. MC3T3-E1 cells were treated with NGR1 (50 μmol/L) for 48 h in the NGR1 group; MC3T3-E1 cells were not treated with NGR1 in the CTRL group; MC3T3-E1 cells were treated with NGR1 (50 μmol/L) and SB (10 μmol/L) or RU (300 nmol/L) in the NGR1 + SB or NGR1 + RU group, respectively. NGR1: Notoginsenoside R1; Osx: Osterix; ALP: alkaline phosphatase; SB: SB203580; RU: Ruxolitinib; CTRL: control; p-: phosphorylated-; t-: total-; MAPK: mitogen-activated protein kinase; JAK1: janus kinase 1; STAT3: signal transducer and activator of transcription 3. *p < .05, **p < .01, or ***p < .001 compared to CTRL; #p < .05 compared to NGR1.
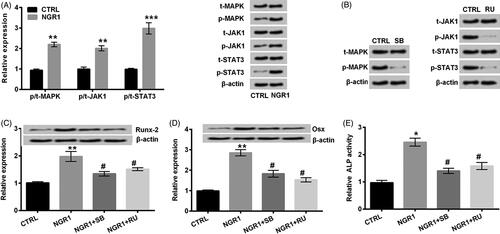
Figure 4. NGR1 up-regulated the expression of miR-23a. MC3T3-E1 cells were treated with NGR1 (50 μmol/L) for 48 h in the NGR1 group; MC3T3-E1 cells were not treated with NGR1 in the CTRL group. NGR1: Notoginsenoside R1; CTRL: control; miR-23a: microRNA-23a. **p < .01 compared to CTRL.
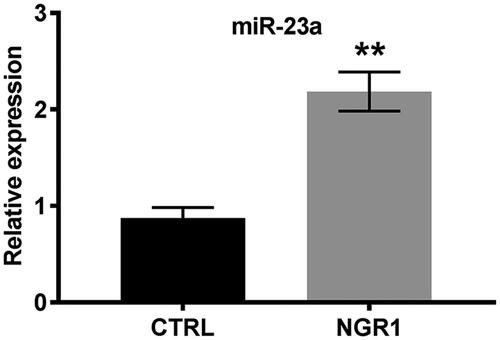
Figure 5. NGR1 accelerated the differentiation of MC3T3-E1 cells by increasing the expression of miR-23a. (A) The expression of miR-23a was down-regulated by miR-23a inhibitor. (B) miR-23a inhibitor reduced the protein expression of Runx-2 induced by NGR1. (C) miR-23a inhibitor decreased the protein expression of Osx induced by NGR1. (D) miR-23a inhibitor inactivated the activity of ALP stimulated by NGR1. MC3T3-E1 cells were treated with NGR1 (50 μmol/L) for 48 h in the NGR1 group; MC3T3-E1 cells were not treated with NGR1 in the CTRL group; MC3T3-E1 cells were treated with NGR1 and transfected with miR-23a inhibitor in the NGR1 + miR-23a inhibitor group; MC3T3-E1 cells were treated with NGR1 and the corresponding negative control of miR-23a in the NGR1 + NC group. miR-23a: microRNA-23a; NGR1: Notoginsenoside R1; CTRL: control; NC: negative control; Osx: Osterix; ALP: alkaline phosphatase. *p < .05 or **p < .01 compared to CTRL; #p < .05 or ##p < .01 compared to NGR1 + NC.
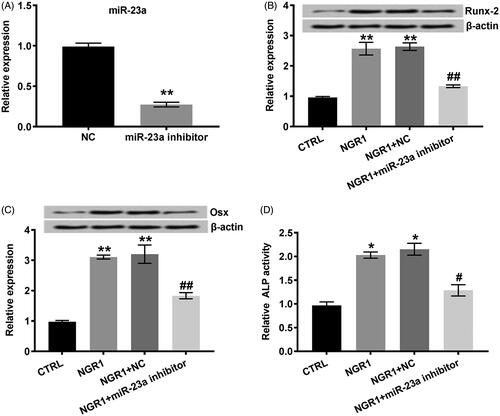
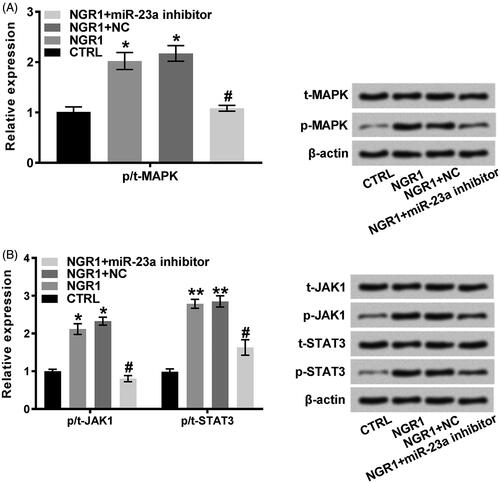
Figure 6. NGR1 enhanced the phosphorylated expression of MAPK, JAK1 and STAT3 by promoting the expression of miR-23a. (A) miR-23a inhibitor repressed the phosphorylation of MAPK promoted by NGR1. (B) miR-23a inhibitor decreased the phosphorylated expression of JAK1 and STAT3 in the MC3T3-E1 cells pre-treated with NGR1. MC3T3-E1 cells were treated with NGR1 (50 μmol/L) for 48 h in the NGR1 group; MC3T3-E1 cells were not treated with NGR1 in the CTRL group; MC3T3-E1 cells were treated with NGR1 and transfected with miR-23a inhibitor in the NGR1 + miR-23a inhibitor group; MC3T3-E1 cells were treated with NGR1 and the corresponding negative control of miR-23a in the NGR1 + NC group. NGR1: Notoginsenoside R1; NC: negative control; p-: phosphorylated-; t-: total-; MAPK: mitogen-activated protein kinase; JAK1: janus kinase 1; STAT3: signal transducer and activator of transcription 3. *p < .05 or **p < .01 compared to CTRL; #p < .05 or ##p < .01 compared to NGR1 + NC.