Figures & data
Table 1. Primers used in this study.
Figure 1. Tofacitinib suppresses ox-LDL-induced attachment of human monocyte THP-1 cells to HAECs. HAECs were stimulated with 100 mg/L ox-LDL in the presence or absence of tofacitinib (100, 500 nM) for 24 h. Representative fluorescence microscopic images of THP-1 cells attached to HAECs and quantitative analysis. Scale bar, 50 μM. (*, p < .01 vs. vehicle control; #, p < .01 vs. ox-LDL group, $, p < .01 vs. ox-LDL + 100 nM tofacitinib group, ANOVA, n = 5–6).
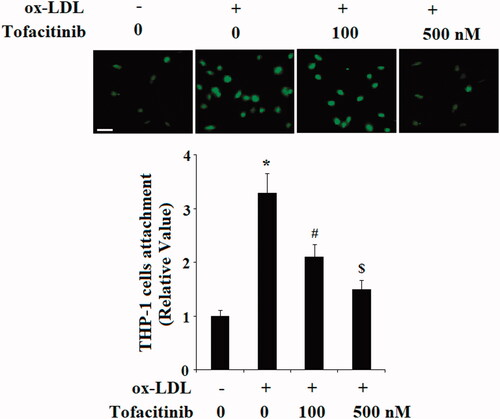
Figure 2. Tofacitinib inhibits ox-LDL-induced expression of VCAM-1 and E-selectin. (A) Real-time PCR analysis of VCAM-1 and E-selectin; (B) Western blot analysis of VCAM-1 and E-selectin (*, p < .01 vs. vehicle control; #, p < .01 vs. ox-LDL group, $, p < .01 vs. ox-LDL + 100 nM tofacitinib group, ANOVA, n = 5–6). HAECs were stimulated with 100 mg/L ox-LDL in the presence or absence of tofacitinib (100, 500 nM) for 24 h.
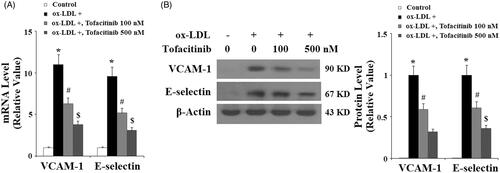
Figure 3. Tofacitinib decreases ox-LDL-induced expression of LOX-1. HAECs were stimulated with 100 mg/L ox-LDL in the presence or absence of tofacitinib (100, 500 nM) for 24 h. (A) Real-time PCR analysis of LOX-1; (B) Western blot analysis of LOX-1 (*, p < .01 vs. vehicle control; #, p < .01 vs. ox-LDL group, $, p < .01 vs. ox-LDL + 100 nM tofacitinib group, ANOVA, n = 5–6).
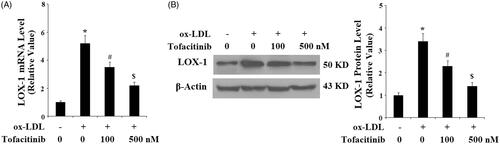
Figure 4. Tofacitinib suppresses ox-LDL-induced production of the pro-inflammatory cytokines TNF-α and IL-1β. HAECs were stimulated with 100 mg/L ox-LDL in the presence or absence of tofacitinib (100, 500 nM) for 24 h. (A) Real-time PCR analysis of TNF-α and IL-1β; (B). ELISA analysis of TNF-α and IL-1β (*, p < .01 vs. vehicle control; #, p < .01 vs. ox-LDL group, $, p < .01 vs. ox-LDL + 100 nM tofacitinib group, ANOVA, n = 5–6).
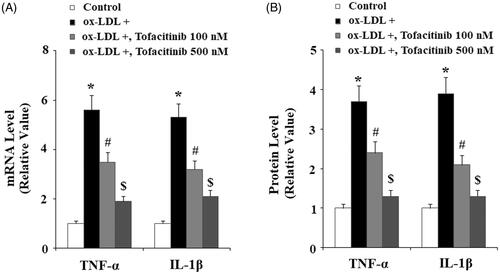
Figure 5. Tofacitinib ameliorates ox-LDL-induced generation of reactive oxygen species (ROS). HAECs were stimulated with 100 mg/L ox-LDL in the presence or absence of tofacitinib (100, 500 nM) for 24 h. Intracellular ROS was determined by the DCFH-DA assay. Scale bar, 100 μM. (*, p < .01 vs. vehicle control; #, p < .01 vs. ox-LDL group, $, p < .01 vs. ox-LDL + 100 nM Tofacitinib group, ANOVA, n = 5–6).
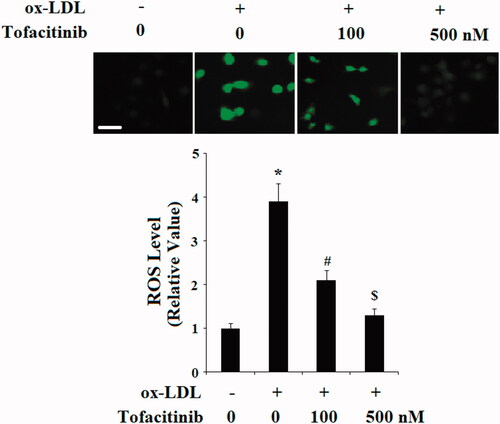
Figure 6. Tofacitinib ameliorates ox-LDL-induced LDH release and reduction of cell viability. HAECs were stimulated with 100 mg/L ox-LDL in the presence or absence of tofacitinib (100, 500 nM) for 48 h. (A). LDH release was determined using a commercial kit; (B) Cell viability was determined by MTT assay (*, p < .01 vs. vehicle control; #, p < .01 vs. ox-LDL group, $, p < .01 vs. ox-LDL + 100 nM tofacitinib group, ANOVA, n = 5–6).
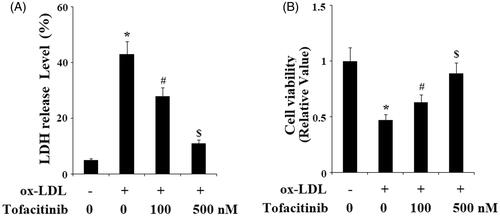
Figure 7. Tofacitinib mitigates ox-LDL-induced phosphorylation and degradation of IκBα. HAECs were stimulated with 100 mg/L ox-LDL in the presence or absence of tofacitinib (500 nM) for 6 h. Phosphorylated and total levels of IκBα were determined by Western blot analysis (*, p < .01 vs. vehicle control; #, p < .01 vs. ox-LDL group, ANOVA, n = 5–6).
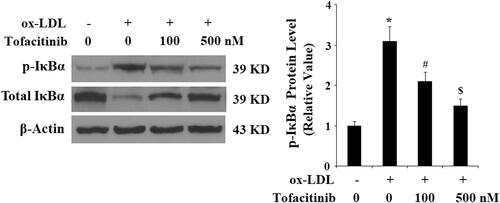
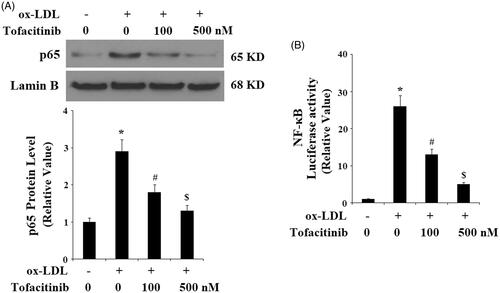
Figure 8. Tofacitinib inhibits ox-LDL-induced activation of NF-κB. HAECs were stimulated with 100 mg/L ox-LDL in the presence or absence of tofacitinib (100, 500 nM) for 24 h. (A). Nuclear level of p65; (B). Luciferase activity of NF-κB promoter (*, p < .01 vs. vehicle control; #, p < .01 vs. ox-LDL group, ANOVA, n = 5–6).