Figures & data
Figure 1. Inhibitory effects of Shikonin on A375 cells. (A) Chemical structure of Shikonin. (B) A375 cells were treated with different concentrations of Shikonin (0–16 μM) for 24 h. (C) A375 cells were treated with the indicated concentration of Shikonin for 24 h, and morphological changes were visualized under the inverted microscopy. A representative result from three separate experiments is shown. ****p < .0001 compared with the control group.
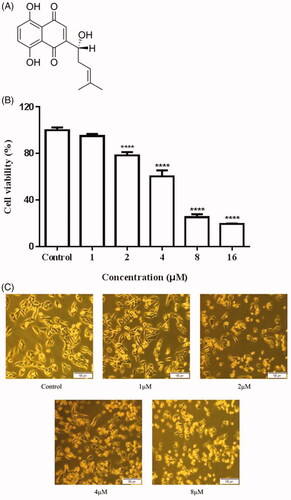
Figure 2. Effects of Shikonin on cell-cycle distribution and cycle-associated proteins in A375 cells. (A) A375 cells were incubated with different concentrations of Shikonin for 24 h. The percentage of A375 cells in G0/G1, S, and G2/M phase was measured by flow cytometry. (B) A375 cells treated with Shikonin (2 μM) for 3, 6, and 12 h. Western blotting was performed for the detection of cyclin B1 and p21. β-Actin was used as a loading control. A representative result from three separate experiments is shown. ** p < .01, **** p < .0001 compared with the control group.
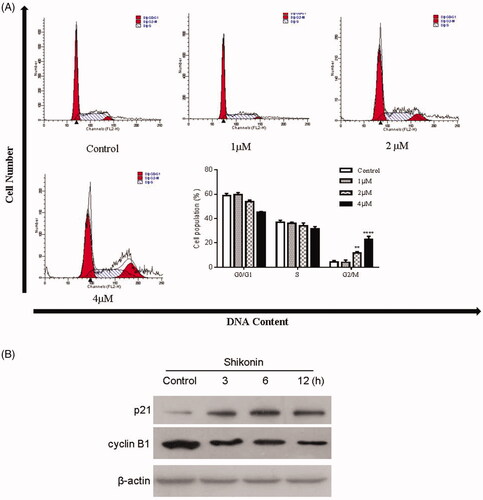
Figure 3. Shikonin induces apoptosis in A375 cells. (A) After treated with Shikonin (0, 1, 2, and 4 μM) for 24 h, the A375 cells were incubated with Hoechst 33258 staining. Apoptotic cells exhibited karyopyknosis. (B) After treatment with increased doses of Shikonin (0, 1, 2, and 4 μM) for 24 h, induction of apoptosis in A375 cells measured by Annexin V/PI double-staining assay followed by flow cytometry analysis. (C) A375 cells treated with Shikonin (2 μM) for 3, 6, and 12 h. Effects of Shikonin on the expression of apoptosis-related proteins. β-Actin was measured as an internal control. The image shown is representative of three separate experiments. ***p < .01, ****p < .0001 compared with the control group.
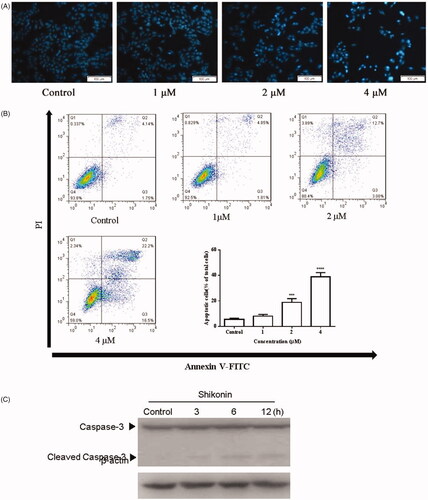
Figure 4. Shikonin induces apoptosis mediated by ROS generation in A375 cells. (A) A375 cells were treated with different concentrations of Shikonin for 6 h. Flow cytometry was used to detect the levels of ROS. (B) A375 cells were pretreated with NAC (8 mM) for 1 h, and then Shikonin (2 μM) was added to the cells for 24 h. Flow cytometry was used to detect the change of apoptosis in A375 cells. A representative result from three separate experiments is shown. **p < .01, ****p < .0001 compared with the control group.
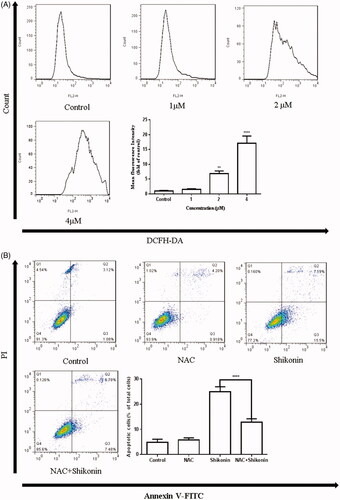
Figure 5. Shikonin induces apoptosis of A375 cells via ROS-mediated ER stress signalling pathway. (A) A375 cells were treated with Shikonin (2 μM) for 3, 6, and 12 h. Western blotting was used to detect the levels of protein associated with ER stress activation. (B) A375 cells were pretreated with NAC (8 mM) for 1 h, and then Shikonin (2 μM) was added to the cells for 6 h. Western blotting was used to detect the changes of p-eIF2α and CHOP. β-Actin was measured as an internal control. The image shown is representative of three separate experiments. **p < .01, *** p < .001, ****p < .0001 compared with the control group.
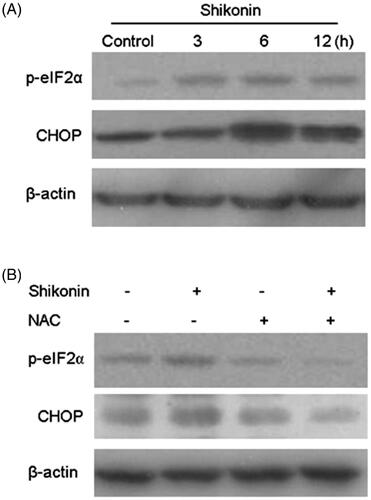
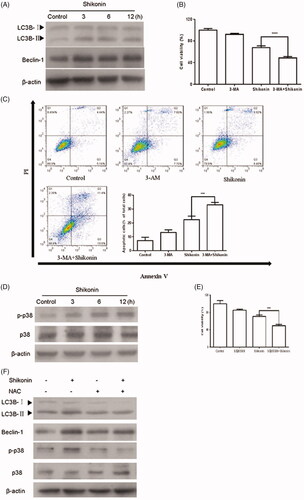
Figure 6. Shikonin induces ROS/p38-mediated protective autophagy to against apoptosis in A375 cells. (A) Western blot was performed to analyze the expression of autophagic markers after incubating A375 cells with 2 μM Shikonin for 3, 6, and 12 h. After pretreatment with 3-MA (5 mM) 1 h, and then incubated with 2 μM Shikonin for 24 h, the changes of cell viability (B) and apoptosis (C) were detected by CCK-8 assay and flow cytometry in A375 cells. (D) Western blot analysis of p-p38 after incubating A375 cells with 2 μM Shikonin for 3, 6, and 12 h. (E) The cell viability of A375 cells was determined by CCK-8 assay after pretreated with SB203580 (5 μM) for 1 h followed by 2 μM Shikonin for 24 h. (F) A375 cells were pretreated with NAC (8 mM) for 1 h followed by 2 μM Shikonin for 6 h to detect the effects of ROS on p38-mediated autophagy. β-Actin was measured as an internal control. The image shown is representative of three separate experiments. ***p < .001, ****p < .0001 compared with the control group.