Figures & data
Figure 1. The morphology of isolated cells from NOA testis. (a) Two types of cells are visible. The thick arrow represents the stem cells of the spermatogony. The thin arrow represents the Sertoli cells. (Scale bar: 50 µm). (b) The Sertoli cells attached to the plate and formed spindle-like shape (Scale bar: 200 µm). (c) The present of FSH receptor in Sertoli cells was confirmed by imunocytochemistry technique (Scale bar: 100 µm). (d) The control group without the primary antibody and stained with PI (Scale bar 100 µm).
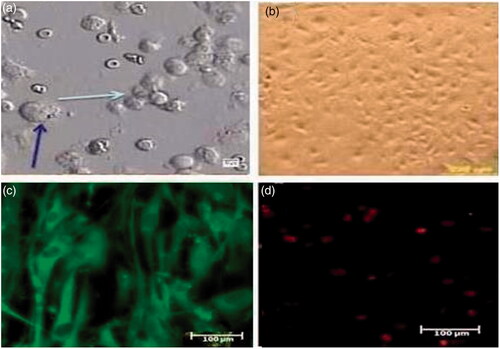
Figure 2. The efficiency of Sertoli cells enrichment was quantitatively assessed by flow cytometry. Attached Sertoli cells were detached by EDTA–trypsin treatment and labeled with mouse monoclonal anti-vimentin antibody overnight at 4 °C. The cells were incubated with FITC-conjugated anti-mouse antibody for 1 h. Negative control was incubated only with FITC-conjugated goat anti-mouse antibody. The results showed Vimentin positive characteristic in attached layer.
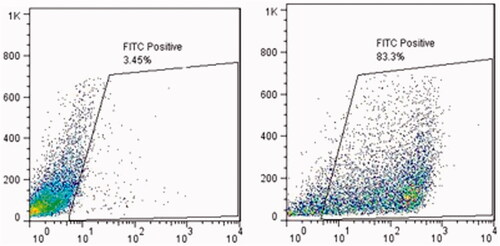
Figure 3. Multiplex PCR from normal man, woman and NOA patients with AZFc microdeletions. Line 1, normal men, multiplex 1; line 2, normal woman, multiplex 1; line 3, NOA patient with AZFc microdeletions in sY254 region, multiplex1; line 4, Gene RulerTM (DNA Ladder,100 bp, Fermentase # SM0333); line 5, normal men, multiplex 2; line 6, normal woman, multiplex 2; line 7, NOA patient with AZFc microdeletions in sY255 region, multiplex 2. Multiplex 1 included SRY: 427 bp, sY254: 400 bp (AZFc), sY86: 320 bp (AZFa), sY127: 274 bp (AZF b). Multiplex 2 included SRY: 472 bP, sY84: 326 bp (AZFa), sY134: 301 bp (AZFb), sY255: 126 bp (AZFc).
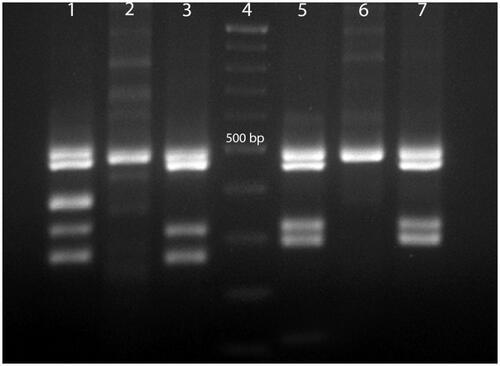
Figure 4. The SSCs colonies in the control, gelatin and SACS groups on day 14 after culture. (a) Control group, (b) gelatin group and (c,d) SACS group. As seen, no colonies were observed in the control group and only single cells and small clusters of SSCs were observed in this group. Magnification: 50 and 20 micrometers.
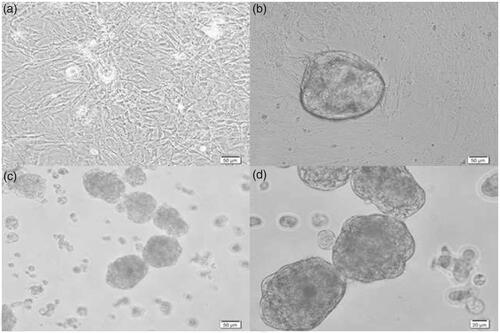
Figure 5. The comparison of the number and diameter of colonies in SACS and gelatin-coated plate groups (*p < .05), (**p < .01). As it is observed in the figure, there is no significant difference in diameters of colonies between two groups during 14 days.
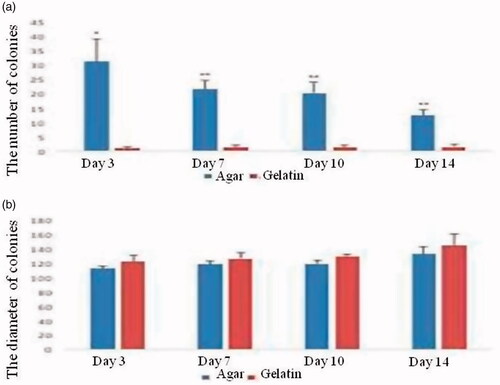
Figure 6. The relative fold change of Oct4, Stra8, Scp3 and Acrosin genes expression in spermatogonial cells that cultured in SACS, gelatin-coated plate and control groups. Notes: Values are mean ± SEM. *indicated statistically significant difference (p < .05), **indicated statistically significant difference (p < .01).
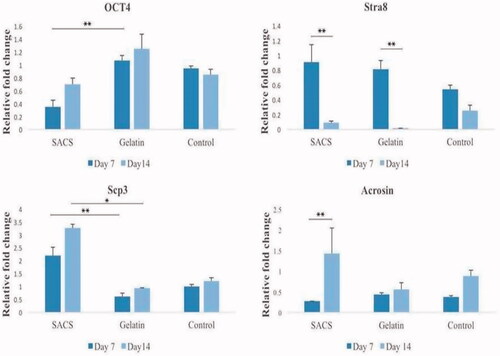
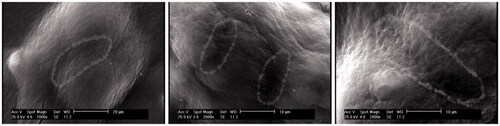
Figure 7. Connection between stem cells in SSCs colonies in SACS group. The dashed lines in the image show the connection of two cells in the colony.