Figures & data
Table 1. The Primer sequences included in this study.
Figure 1. Relative LUCAT1 expression in CC tissues and its clinical significance. (a) Unsupervised clustering of patients based on the expression pattern of differentially expressed lncRNAs using TCGA datasets. (b) Volcano Plot visualizing the differentially expressed lncRNAs using TCGA datasets. The vertical lines demark the fold-change value. (c) TCGA cohort analysis of the expression levels of LUCAT1 in CC samples as well as in the normal bone tissues. (d) LUCAT1 expression was examined by qRT-PCR in 125 paired CC tissues and adjacent non-tumour tissues. (e) qRT-PCR analysis determined the expression of LUCAT1 in six CC cell lines and E6E7. (f) Kaplan–Meier curves for survival time in patients with CC divided according to LUCAT1 expression. *p < .05, **p < .01.
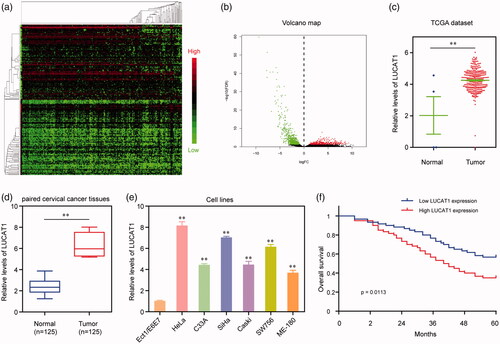
Table 2. Clinicopathological features associated with LUCAT1 expression in 125 CC patients.
Table 3. Univariate and multivariate analysis of clinicopathological factors for overall survival in 125 patients with CC.
Figure 2. The transcription factor SP1 was involved in LUCAT1 upregulation. (a) The predicted sites of putative SP1 binding motif in human LUCAT1 promoter. (b) The relative mRNA levels of SP1 in HeLa and SiHa cells after transfection of SP1 siRNAs. (c) Transfection of SP1 overexpressing plasmids, pcDNA3.1-SP1, increased the mRNA levels of SP1. (d) The relative expression levels of LUCAT1 in HeLa and SiHa cells after transfection of SP1 siRNAs or pcDNA3.1-SP1. (e) ChIP assays analyzed the SP1 binding sites. (f) The schematic diagram of constructed luciferase reporter plasmids. (g) The relative luciferase activities examined by Dual luciferase reporter assays. *p < .05, **p < .01.
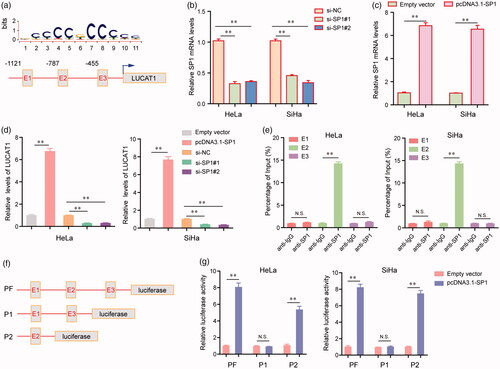
Figure 3. LUCAT1 affected the proliferation and apoptosis of HeLa and SiHa cells. (a) The relative expression levels of LUCAT1 in HeLa and SiHa cells after transfection of LUCAT1 siRNAs (LUCAT1-siRNA#1 and LUCAT1-siRNA#2) or negative control (NC) siRNAs. (b) The growth curves of HeLa and SiHa cells after transfection of LUCAT1 siRNAs or NC siRNAs. (c) Transfection of LUCAT1 siRNAs reduced the colony formation abilities of HeLa and SiHa cells. (d) Silence of LUCAT1 accelerated the cell apoptosis. (e) Western blot assays detected the protein levels of caspase-3 and caspase-9. *p < .05, **p < .01.
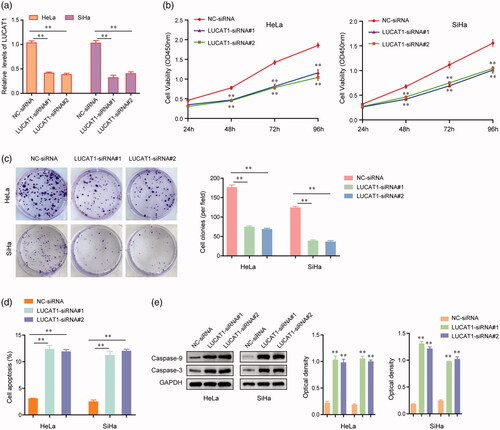
Figure 4. LUCAT1 affected the invasion and migration of HeLa and SiHa cells. (a,b) Transfection of LUCAT1 siRNAs reduced the migratory abilities of HeLa and SiHa cells. (c) Knockdown of LUCAT1 reduced the invasion of HeLa and SiHa cells. (d,e) Silence of LUCAT1 siRNAs significantly decreased the protein levels of N-cadherin and vimentin. *p < .05, **p < .01.
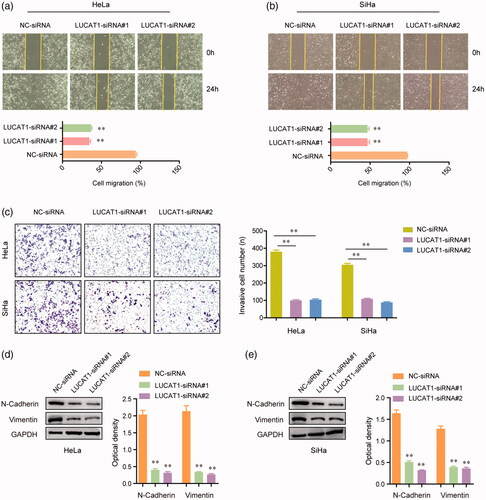
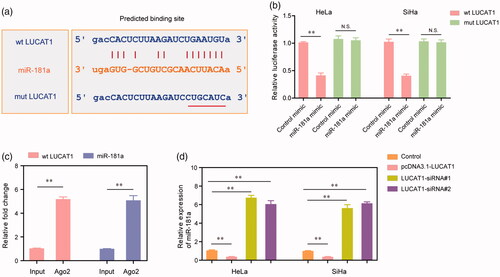
Figure 5. miR-181a was a direct target of LUCAT1. (a) The binding site of miR-181a was predicted by “starbase”. (b) The luciferase activities of HeLa and SiHa cells. (c) RIP assays examined the enrichment of LUCAT1 and miR-181a Ago2-containing beads. (d) The relative expression of miR-181a in HeLa and SiHa cells. *p < .05, **p < .01.