Figures & data
Table 1. List of genes and primer nucleotide sequences.
Figure 1. Scanning electron microscopy images of nanofibers. (A) PLGA nanofibers. (B) PLGA/GO nanofibers. Bar lengths are 10 μm. (C) Average fiber diameter of PLGA and PLGA/GO nanofibers.
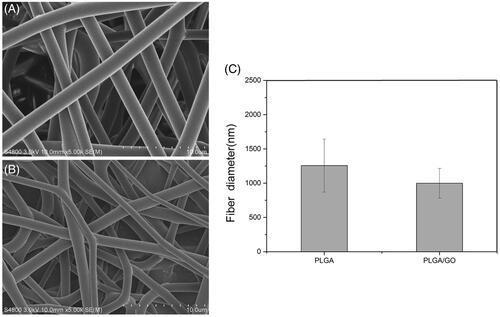
Figure 2. XRD patterns of GO (A) and electrospun nanofibresof PLGA and PLGA/GO (B).
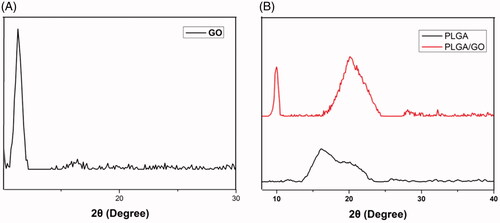
Figure 3. Water contact angle of pure PLGA nanofibres (A) and PLGA/GO nanofibres (B). (C) Average water contact angle of PLGA and PLGA/GO nanofibers. (∗, p < .05, n = 4).
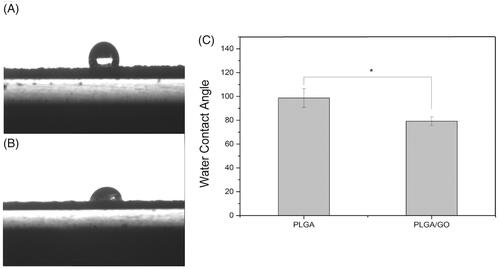
Figure 4. Binding efficiency of IGF-1 and BDNF to PLGA and PLGA/GO nanofibres (A). Cumulative release of IGF-1 and BDNF from PLGA and PLGA/GO nanofibres (B). (∗, p<.05, n = 3).
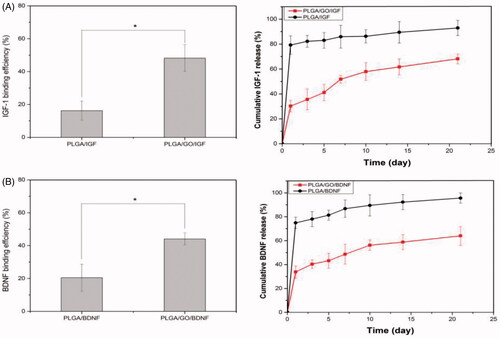
Figure 5. Identification of cultured NSCs in vitro. (A) Representative neurospheres in culture. (B–D) Immunocytochemical staining of purified NSCs. Immunostaining makers are Nestin (B) for NSCs and DAPI (C) for nuclei and their images are merged (D). (Scale bar = 50 µm).
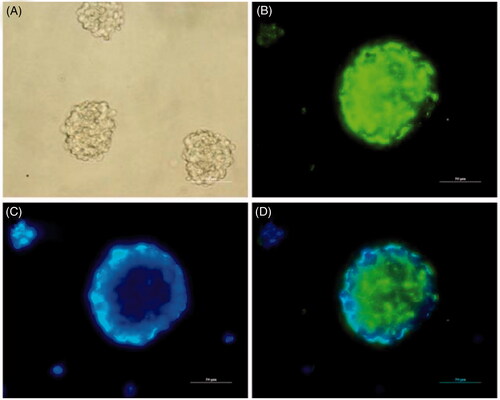
Figure 6. Proliferation of NSCs cultured on PLGA, PLGA/GO, PLGA/GO/BDNF, PLGA/GO/IGF-1 and PLGA/GO/IGF + BDNF for 1, 3, 7 days in vitro. (∗, p < .05, n = 3).
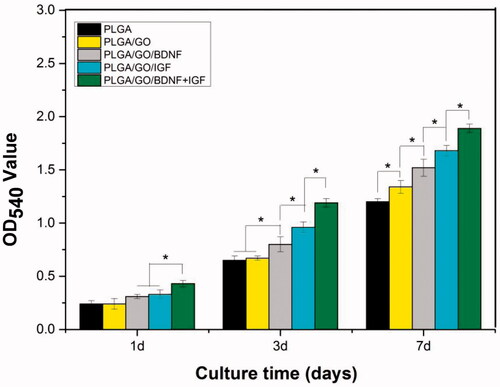
Figure 7. Cell viability of NSCs cultured on PLGA, PLGA/GO, PLGA/GO/IGF, PLGA/GO/BDNF and PLGA/GO/IGF + BDNF under H2O2 treatment. (∗, p < .05, n = 3).
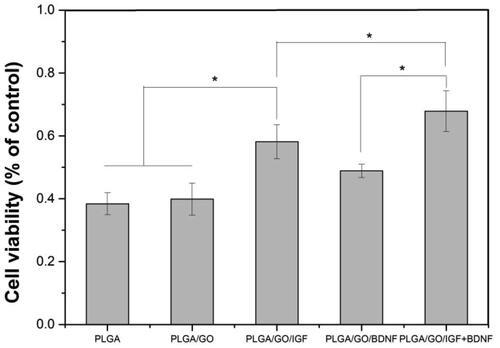
Figure 8. Qualitative and quantitative measurement of NSCs differentiation. Immunocytochemical staining of differentiated neurons and astrocytes on pure PLGA nanofibres (A), PLGA/GO nanofibres (B), PLGA/GO/BDNF nanofibres (C), PLGA/GO/IGF nanofibres (D), and PLGA/GO/IGF + BDNF nanofibres (E). Immunostaining makers are Tuj-1 for neurons, GFAP for astrocytes and DAPI for nuclei. The Scale bar was 100 µm. Quantitative real-time PCR analysis of Tuj-1 (F) and GFAP (G) after NSCs cultured for 7 days. (∗, p < .05, n = 4).
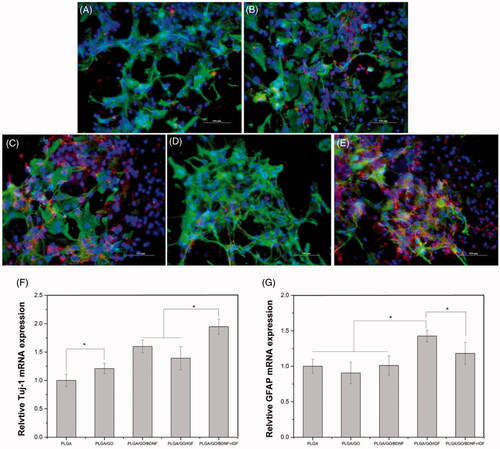
Figure 9. Motor function evaluation of SCI rats within 4 weeks. (A) Representative image of MEP. (B) Amplitude of MEP. (C) BBB scores. (∗, p < .05, n = 3).
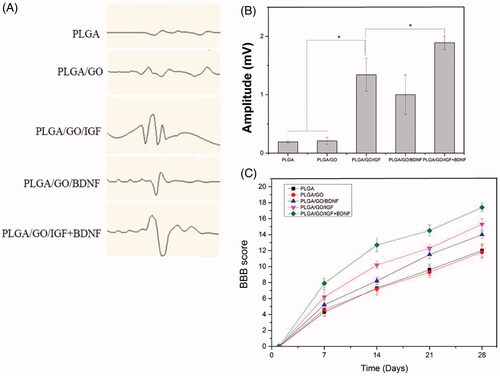
Figure 10. Longitudinal HE staining of spinal cord tissue after 4 weeks post-operation. (A) PLGA group. (B) PLGA/GO group. (C) PLGA/GO/IGF group. (D) PLGA/GO/BDNF group. (E) PLGA/GO/IGF/BDNF group. The Scale bar was 500 µm. (F) Quantification of the cavity areas of spinal cord tissue. (∗, p < .05, n = 4).
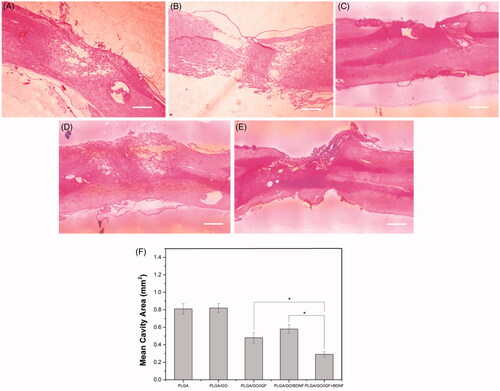
Figure 11. Qualitative and quantitative evaluation of neurons in the injury site after SCI. Immunocytochemical staining of neurons on pure PLGA nanofibers (A), PLGA/GO nanofibers (B), PLGA/GO/IGF nanofibers (C), PLGA/GO/BDNF nanofibers (D) and PLGA/GO/IGF + BDNF nanofibers (E). Immunostaining makers are NeuN for neurons and DAPI for nuclei. The Scale bar was 100 µm. (F) Mean NeuN positive cells per visual field. (∗, p < .05, n = 3).
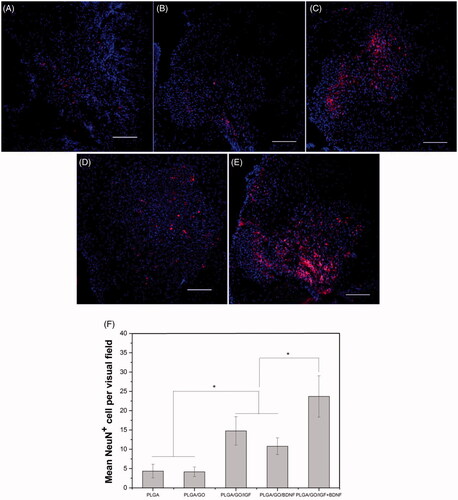
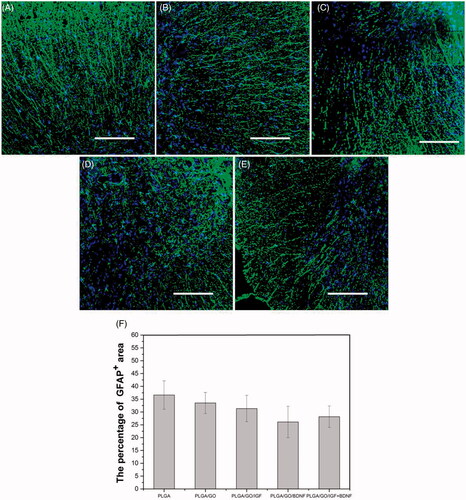
Figure 12. Qualitative and quantitative evaluation of astrocytes in the injury site after SCI. Immunocytochemical staining of astrocytes on pure PLGA nanofibers (A), PLGA/GO nanofibers (B), PLGA/GO/IGF nanofibers (C), PLGA/GO/BDNF nanofibers (D) and PLGA/GO/IGF + BDNF nanofibers (E). Immunostaining makers are GFAP for astrocytes and DAPI for nuclei. The Scale bar was 200 µm. (F) The percentage of GFAP positive area per visual field.