
Figures & data
Figure 1. Analytical process for genetic susceptibility of three patients.
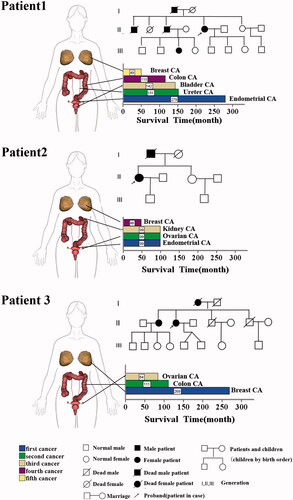
Figure 2. Clinical information and pedigree of three cases of MPMNs. There are three parts, the left side is the site of the disease of three multiple primary cancer patients, which are represented by the 3 D body graph, and the arrow points to the lower right, which is the histogram of the survival time of each patient. The survival time is the period from the diagnosis of the tumour to death or end of follow-up. The end of follow-up of all three patients in this study was 6 November 2017. Corresponding to the upper right is the pedigree for each of the patient.
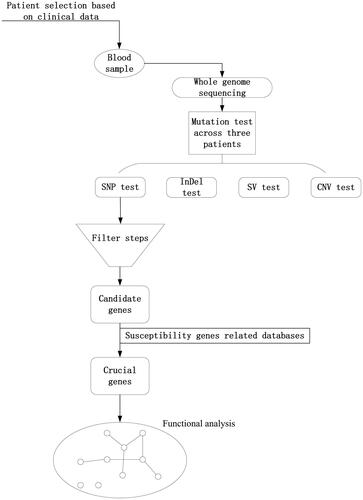
Table 1. Clinical information of three cases of MPMNs.
Table 2. The quality of sequencing data.
Figure 3. Gel electropherogram and the quality of sample DNA for Sequencing.
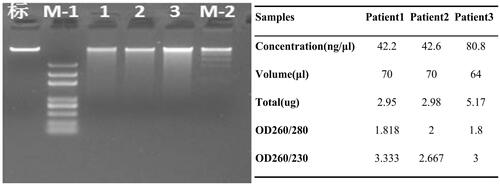
Figure 4. Quality evaluation of sequencing data. The upper graph indicates the coverage depth (left coordinate) and coverage (right coordinate) of each chromosome. The abscissa indicates the chromosome number, the left ordinate indicates the average coverage depth, and the right ordinate indicates the coverage. When calculating the depth of coverage for each chromosome, the formula is: Sequencing data volume/The total length of per chromosome. When calculating coverage, the formula is: the total length covered/the total length of each chromosome. The two images below show the depth of sequencing. The left panel shows the base ratios for different sequencing depths, the abscissa indicates the depth of sequencing, and the ordinate indicates the proportion of bases with a depth of x in all bases; the image is generally distributed around the average depth. The graph on the right shows the cumulative base ratio at different depths. The abscissa indicates the depth of sequencing. The ordinate indicates the proportion of bases with a depth greater than x in all bases. For example, the ratio of bases with a depth of 0X corresponds to 100%. Indicates that there are 100% bases with a sequencing depth greater than 0X.The results show that the coverage of the sequencing data is over 99.8% and the depth is about 30×.
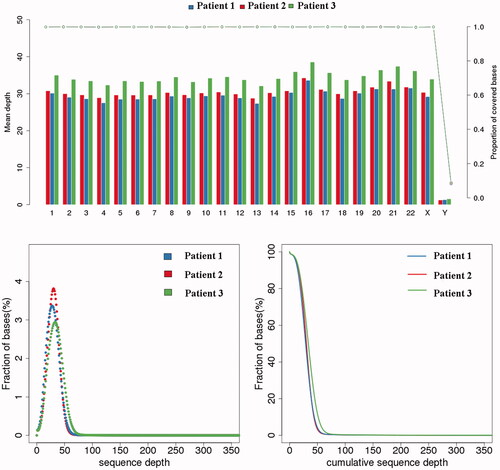
Table 3. The mutation test of sequencing data.
Table 4. List of polymorphism selected from three samples.
Figure 5. The patient-function network analysis. The circle represents the function of the variant gene. The more overlapping the function, the larger the circle.
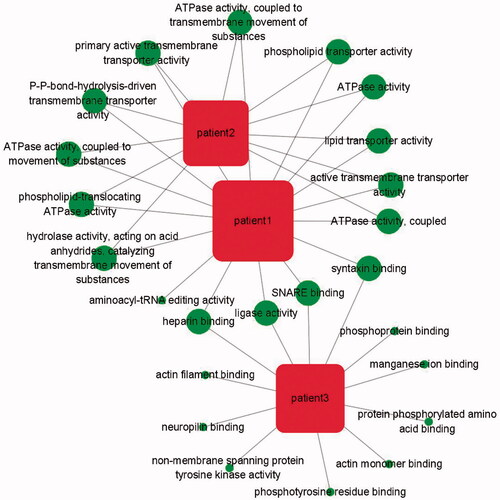
Table 5. The functional analysis of crucial genes.
Figure 6. KEGG pathway of three samples. The top three graphs show the KEGG pathway for each patient. The graph at the bottom left shows network of all the post-screening variations involved. Overall, all variations were detected in genes involved in the FA/BRCA pathway to form a complex network system.
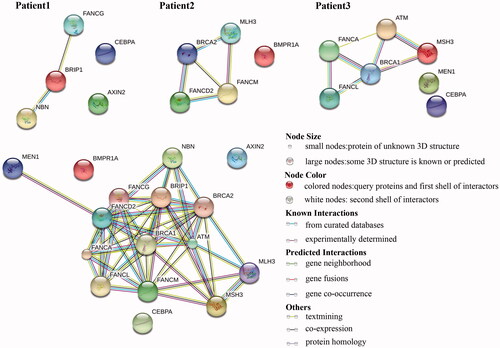
Table 6. KEGG pathway of crucial genes in three samples.
Data availability
All data generated or analysed during this study are included in this published article