Figures & data
Figure 1. Circ_0043278 was identified as a NSCLC-related circRNA. (a) Hierarchical clustering analysis of circRNAs that were differentially expressed in NSCLC tissues and corresponding normal tissues in GSE101586. (b) Top 30 dysregulated circRNAs of GSE101586, the wireframe marked has_circ_102049 has the most fold change level (upregulated). (c) Chromosomal map showing the location of circ_0043278 using UCSC genome browser. (d) Expression of circ_0043287 in the control and tumor samples of GSE101586. (e and f) Expression of circ_0043287 in 44 paired normal and corresponding NSCLC samples was evaluated by qRT-PCR (*p < .05 vs. normal or non-metastasis group).
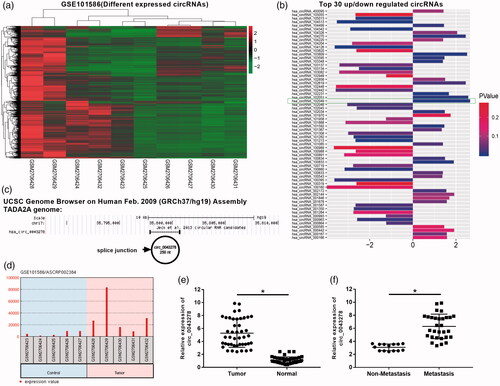
Table 1. Correlations between has_circ_0043278 expression and clinicopathologic characteristics in NSCLC.
Figure 2. Circ_0043278 acts as an oncogenic molecule in NSCLC. (a) Expression of circ_0043278 in 16HBE cell line and four NSCLC cell lines: H1975, A549, SPC-A1, and H1299 (*p < .05 vs. 16HBE cells). (b) Circ_0043278 expression of H1299 cells treated with si-NC, si-Circ#1 and si-Circ#2 was detected by qRT-PCR (*p < .05 vs. si-NC group). (c) Circ_0043278 expression of A549 cells transfected with empty vector and Circ OE was measured via qRT-PCR (*p < .05 vs. vector group). MTT assay was performed to determine cell viability of (d) H1299 cells treated with si-NC, si-Circ#1, and si-Circ#2, or (e) A549 cells treated with empty vector and Circ OE at 0, 24, 48, and 72 h (*p < .05 vs. si-NC or vector group). Tumor sphere formation assay was performed to evaluate cell self-renewal capability in (f) circ_0043278 blocked H1299 cells and (g) circ_0043278 overexpressed A549 cells (*p < .05 vs. si-NC or vector group). Colony formation assay was carried out in (h) si-NC, si-Circ#1 and si-Circ#2 treated H1299 cells or (i) empty vector and Circ OE treated A549 cells to assess the effects of circ_0043278 knockdown and overexpression on cell proliferation (*p < .05 vs. si-NC or vector group). (j–l) Hypodermic injection of H1229 cells transfected with si-circ#1+#2 or si-NC into BALB/c nude mice established xenograft model, tumor weight, and volume were then assessed (*p < .05 vs. si-NC group). (m) Expression of circ_0043278 in H1299 cells treated with si-NC and si-circ#1+#2 was examined by qRT-PCR (*p < .05 vs. si-NC group).
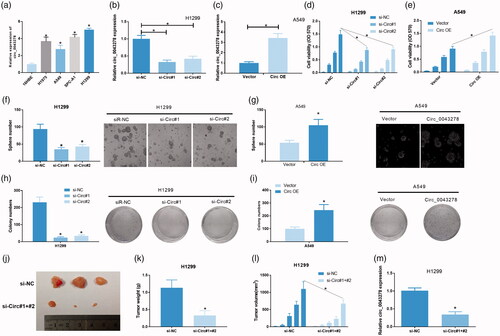
Figure 3. Circ_0043278 promotes NSCLC cell invasion and migration. (a) H1299 cells treated with si-NC, si-Circ#1 and si-Circ#2 were subjected to transwell assay to assess the effects of circ_0043278 knockdown on cell invasion (*p < .05 vs. si-NC group). (b) Effects of circ_0043278 knockdown on cell migration was evaluated by wound-healing assay in H1299 cells (*p < .05 vs. si-NC group). (c) A549 cells treated with vector and Circ OE were subjected to transwell assay to examine the effects of circ_0043278 overexpression on cell invasion (*p < .05 vs. vector group). (d) Effects of circ_0043278 overexpression on cell migration was assessed using wound-healing assay in A549 cells (*p < .05 vs. vector group).
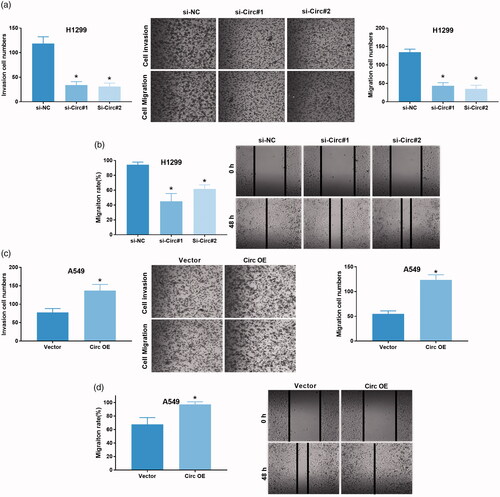
Figure 4. KEGG analysis of circ_0043278 target miRNAs. (a and b) Dual-luciferase reporter assay was performed in H1299 and A549 cells to verify the interaction between circ_0043278 and miR-1229, miR-203, miR-520f, miR-450b-3p, miR-769-3p, miR-526b, or miR-638. (c) Schematic diagram of the establishment of circ_0043278 ceRNA network. (d) KEGG analysis of miR-1299, miR-203, miR-450-3p, miR-520f and miR-526b. (e) The ceRNA network of circ_0043278 within miR-1299, miR-203, miR-450-3p, miR-520f and miR-526b.
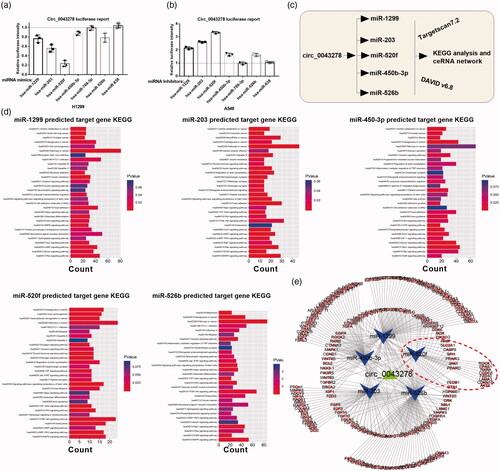
Figure 5. miR-520f expression was significantly decreased in NSCLC. (a) Wild type and mutant sequence of putative binding site between circ_0043278 and miR-520f. (b and c) Interaction between circ_0043278 and miR-520f was verified by dual-luciferase reporter assay in H1299 and A549 cells. (d and e) RNA pull down assay was used to further confirm the interaction between circ_0043278 and miR-520f using biotin-labeled miR-520f. (f) Kaplan–Meier survival analysis of NSCLC patients with low or high miR-520f expression. (g and h) Expression of miR-520f was detected by qRT-PCR in normal and NSCLC tissues. (i) Correlation between circ_0043278 and miR-520f expression.
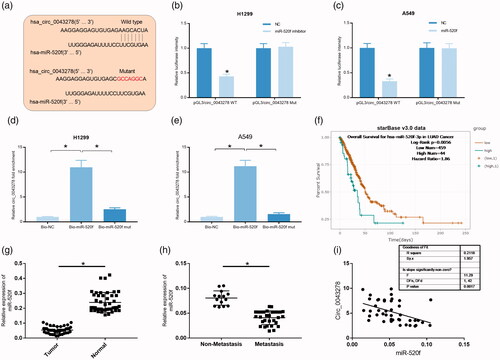
Table 2. Correlations between miR-520f expression and clinicopathologic characteristics in NSCLC.
Figure 6. miR-520f acts as a tumor inhibitor in NSCLC. (a) Relative expression of miR-520f was detected in 16HBE, H1975, A549, SPC-A1 and H1299 cells via qRT-PCR (*p < .05 vs. 16HBE cells). (b) Relative expression of miR-520f in miR-520f mimics treated H1299 cells and miR-520f inhibitor treated A549 cells (*p < .05 vs. scramble or inhibitor NC group). (c) Effects of miR-520f overexpression and knockdown were evaluated by colony formation assay in H1299 and A549 cells, respectively (*p < .05 vs. scramble or inhibitor NC group). (d) Transwell assay was carried out in miR-520f mimics treated H1299 cells and miR-520f inhibitor treated A549 cells to assess the effects of miR-520f on cell invasion (*p < .05 vs. scramble or inhibitor NC group). (e and f) Tumor sphere formation assay was performed to assess the effects of miR-520f overexpression and knockdown on cell self-renewal capability in H1299 and A549 cells, respectively.
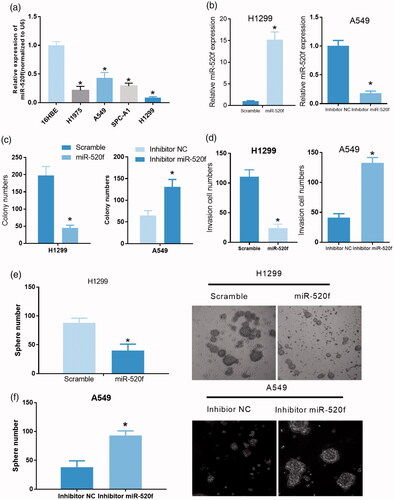
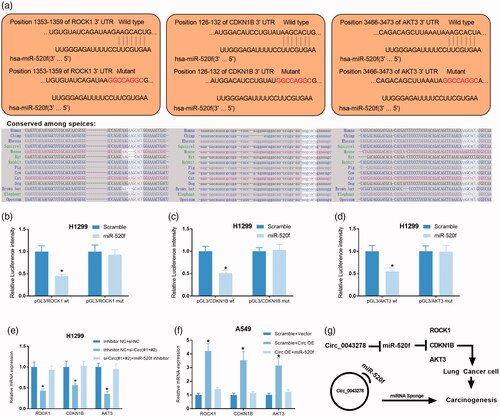
Figure 7. Circ_0043278 regulates ROCK1, CDKN1B, and AKT3 expression in NSCLC cells by sponging miR-520f. (a) Wild type and mutant sequence of putative binding site between miR-520f and ROCK1, CDKN1B or AKT3. (b–d) Interaction between miR-520f and ROCK1, CDKN1B, or AKT3 was verified by dual-luciferase reporter assay in H1299 cells. (e) Relative mRNA expression of ROCK1, CDKN1B, and AKT3 were examined by qRT-PCR in H1299 cells treated with si-Circ#1+#2 + miR-520f inhibitor. (f) Relative mRNA expression of ROCK1, CDKN1B, and AKT3 in A549 cells treated with Circ OE + miR-520f were measured by qRT-PCR assay. (g) The diagram of the mechanisms underlying the circ_0043278/miR-520f axis in NSCLC.