Figures & data
Figure 1. MTT assays to evaluate the proliferation of BMSCs. (A–D) show the growth curves and comparisonof the LC and NLC groups, LO and NLO groups, LV and NLV groups and LD and NLD groups, respectively. *p < .05 and **p < .01.
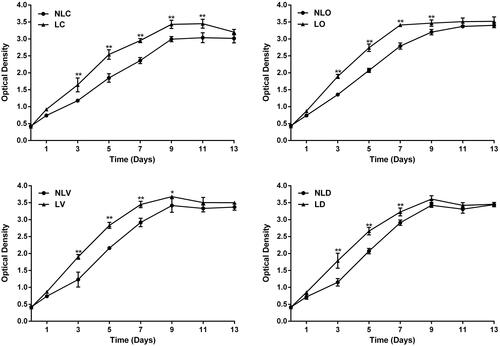
Figure 2. MTT assays to detect the proliferation of BMSCs. (A–H) show the growth curves of the NLC, LC, NLO, LO, NLV, LV, NLD and LD groups, respectively. Comparison of OD value between 2 days in every group was taken. We would mark the same character at the side of OD value if there was not a significant difference between two days, p >.05. No significant difference means that BMSCs proliferation slows down and BMSCs might reach a plateau.
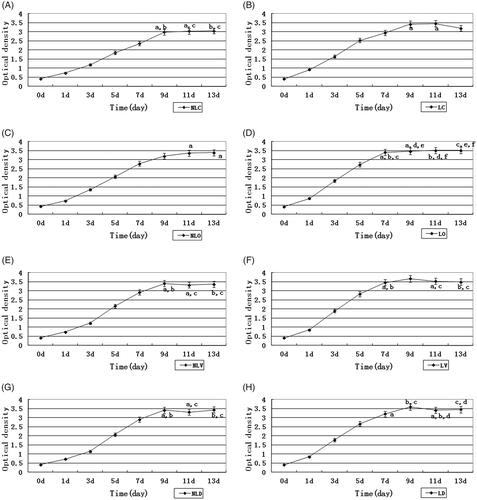
Figure 3. Morphological changes of BMSCs in each group were observed by inverted phase contrast microscope (40×; the scale bar represents 50 µm). The arrows in LC group at day 9 and day 13 indicate cell accumulation. The arrows in NLO (day 9 and day 13), LO (day 9), NLD (day 9 and day 13) and LD (day 9) groups indicate “rod-like” structures. The arrows in LO (day 13) and LD (day 13) groups indicate porous trabecular bone structures, suggesting BMSCs differentiate into osteoblasts. The arrows in LV (day 13) group indicate “ring-like” cell populations, suggesting BMSCs differentiate into vascular endothelial cells and have a tendency to form microvascular structures.
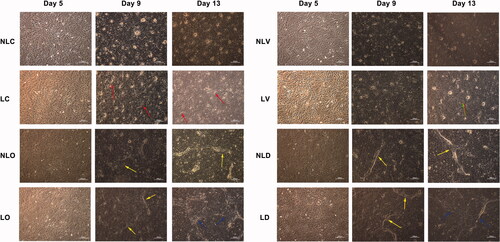
Figure 4. The ultrastructural changes of BMSCs were detected by transmission electron microscopy (10000×). The arrows in the LC (day 9 and day 13), NLO (day 9 and day 13), and LO (day 5, day 9 and day 13) groups indicate myeloid bodies. The arrows indicate matrix vesicles and the arrows indicate the dilated endoplasmic reticulum, suggesting BMSCs differentiated into osteoblasts. The circled regions were zoomed in on at the bottom left corner (square box). The arrows in the NLV (day 13), NLD (day 9) and LD (day 5) groups indicate desmosome connections. The arrows in the LV (day 9 and day 13) and LD (day 13) groups indicate W–P bodies. The arrows in the NLD (day 13) group indicate microvilli. The arrows in LD (day 9) indicate tight connections, suggesting BMSCs differentiated into vascular endothelial cells and formed microvascular-like structures.
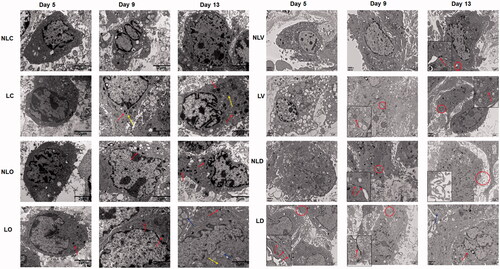
Figure 5. The expression of osteocalcin and vWF in BMSCs was detected by confocal microscope (200×; the scale bar represents 100 µm). The arrows in LC (day 13), LO (day 9 and day 13 left), NLD (day 13) and LD (day 9 and day 13) groupsin LC (day 13), LO (day 9 and day 13 left), NLD (day 13) and LD (day 9 and day 13) groups indicate cell accumulation. The arrows in NLO (day 13) and LO (day 13 right) groupsin NLO (day 13) and LO (day 13 right) groups indicate “lamellar-like” arrangement of cells, suggesting BMSCs differentiated into osteoblasts. The rings in LV (day 13) and LD (day 13) groupsin LV (day 13) and LD (day 13) groups in LV (day 13) and LD (day 13) groupsin LV (day 13) and LD (day 13) groups indicate “ring-like” structures, suggesting BMSCs differentiated into endothelial cells.
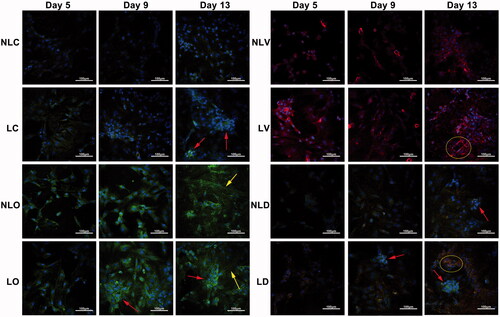
Figure 6. The expression of osteocalcin and vWF in BMSCs was detected by flow cytometry. The upper left quadrant indicates the number of cells positively expressed vWF. The upper right quadrant indicates the number of positive cells simultaneously expressed vWF and osteocalcinexpressed vWF and osteocalcin. The lower left quadrant indicates the number of cells expressed neither vWF nor osteocalcin, and the lower right quadrant indicates the number of positive cells expressed osteocalcin.
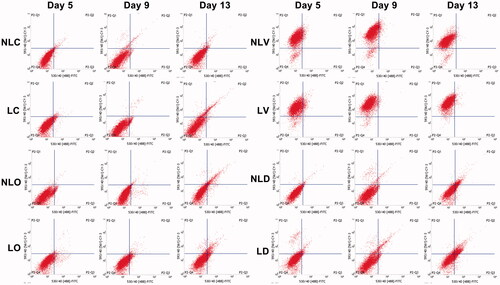
Figure 7. Analysis of the differentiation rate of BMSCs. A–D show the differentiation rates of the NLC and LC groups, NLO and LO groups, NLV and LV groups, NLD and LD groups, respectively. The differentiation rates of the LIPUS group were obviously higher than those in the non-LIPUS group. LIPUS groups (LC, LO, LV, and LD groups) vs. non-LIPUS groups (NLC, NLO, NLV, and NLD groups), *p < .05.
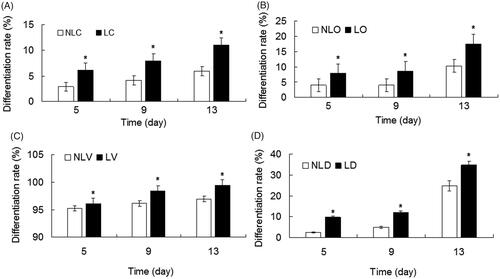
Figure 8. The relative expression levels of osteocalcin and vWF in BMSCs of each group were detected by quantitative real-time PCR and compared. A–D show, respectively the relative expression levels of osteocalcin in the NLC and LC groups, NLO and LO groups, NLV and LV groups and NLD and LD groups. E–H show respectively the relative expression levels of vWF in the NLC and LC groups, NLO and LO groups, NLV and LV groups and NLD and LD groups. LIPUS groups (LC, LO, LV, and LD groups) vs. non-LIPUS groups (NLC, NLO, NLV, and NLD groups), *p < .05.
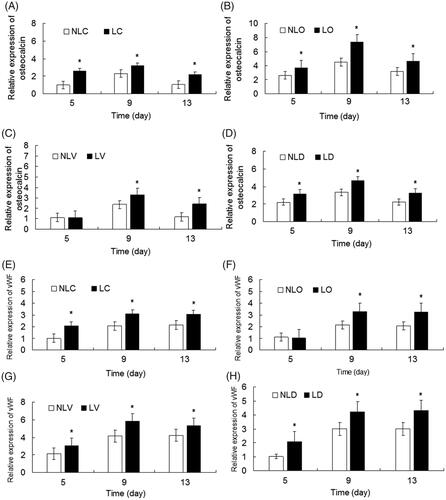
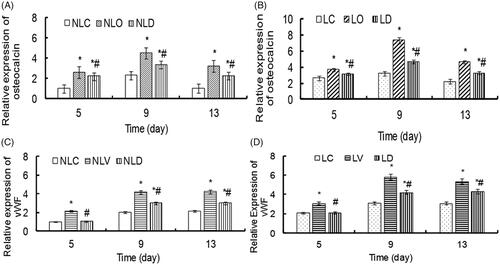
Figure 9. The relative expression levels of osteocalcin and vWF in BMSCs of each group were detected by quantitative real-time PCR. The relative gene expression of osteoblast inducer groups (LO, NLO, LD and NLD groups) and endothelial cell inducer groups (LV, NLV, LD and NLD groups) in the LIPUS and non-LIPUS groups were compared. (A) The relative expression of osteocalcin in the NLC, NLO and NLD groups. Compared with the NLC group, *p < .05. Compared with the NLO group, #p < .05. (B) The relative expression of osteocalcin in the LC, LO and LD groups. Compared with the LC group, *p < .05. Compared with the LO group, #p < .05. (C) The relative expression of vWF in the NLC, NLV and NLD groups. Compared with the NLC group, *p < .05. Compared with the NLV group, #p < .05. (D) The relative expression of vWF in the LC, LV and LD groups. Compared with the LC group, *p < .05. Compared with the LV group, #p < .05.