
Figures & data
Figure 1. (a) CEHDA set-up consisting of the coaxial needle, Twin syringe pump, and high-voltage DC power supplies with positive and negative electrodes connected with crocodile clip, Aluminium plate, and microscopic lens combined with CCD camera, computer and light source. (b) Inner and outer needles with a coaxial set-up.
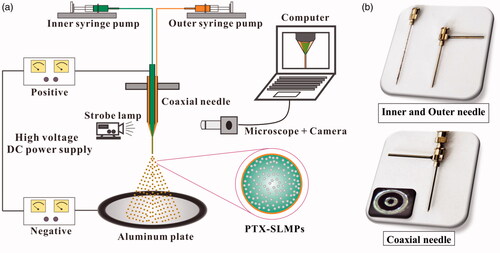
Figure 2. The stable cone-jet mode and the PTX-SLMPs producing CEHDA process. (a) The morphology of the coaxial cone and the coaxial jet; (b) Size distribution of PTX-SLMPs; (c) Confocal fluorescence microscopic image showing the core-shell structure of the fluroescent-labelled PTX-SLMPs; (d) SEM image of PTX-SLMPs prepared by CEHDA process.
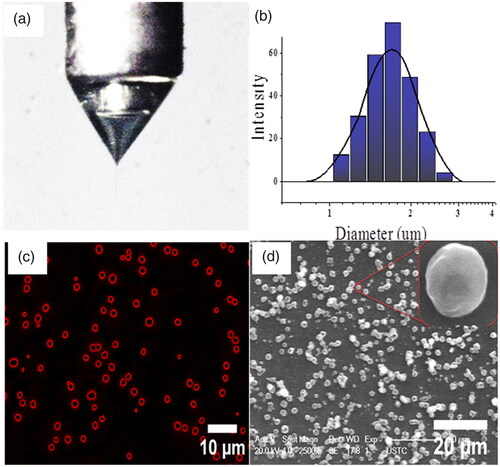
Figure 3. In vitro dissolution profiles of PTX from Taxol® and PTX-SLMPs conducted in PBS (a) represents the complete release profile of PTX (b) enlarged figure representing the release in first 24 h.
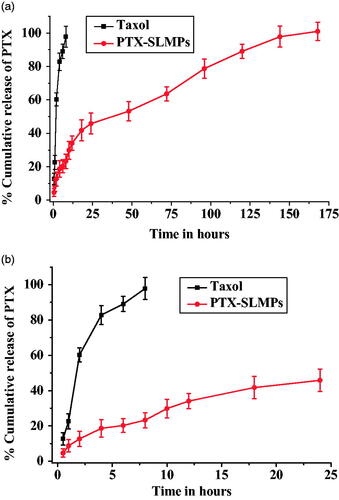
Figure 4. Percentage cell viability assay of SKOV-3 cells at (a) 24 h, (b) 48 h and (c) 72 h after the treatment with Taxol® and PTX-SLMPs when analysed by MTT cell proliferation assay. *p < .05 compared to group treated with Taxol®.
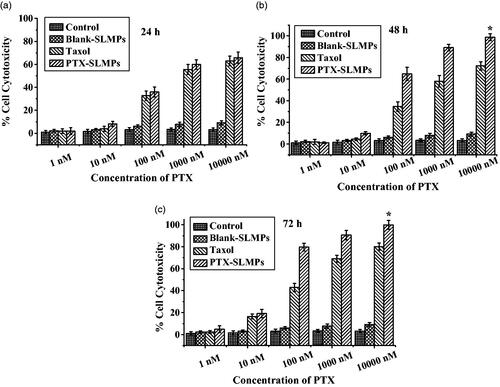
Table 1. IC50 Value of taxol® and PTX-SLMPs at (a) 24 h, (b) 48 h and (c) 72 h calculated based on MTT assay (n = 3, # p < .001 taxol®/PTX-SLMPs).
Figure 5. (a) Confocal fluorescence image of single XY optical section of SKOV-3 cells. (i) Image reveals the uptake of fluorescent labelled PTX-SLMPs; (ii) Cells treated with plain Nile red at equivalent concentrations. Blue florescent signals were arising from DAPI, a nucleus staining dye. (b) Fluorescence activated cell shorter (FACS) images of SKOV-3 cells after the treatment with fluorescent-labelled PTX-SLMPs and plain Nile red. (i) Cells without treatment (control); (ii) Cells incubated with Nile red at equivalent concentrations; (iii) Cells incubated with fluorescent labelled PTX-SLMPs. (c) The mean fluorescent intensity of control (cells without treatment), plain nile red and fluorescent-labelled SLMPs. *p < .05 compared to plain nile red.
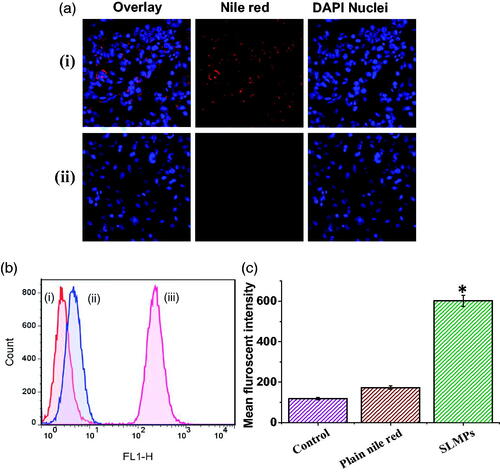
Figure 6. (a) Cell apoptosis analysis performed by dual staining with FITC-Annexin V/PI. PTX-SLMPs show significant increase in the Apoptosis in comparison with Taxol®. b) Pharmacokinetics of PTX-SLMPs and Taxol® given at the dose of 10 mg/kg to the Wistar rats after i.p. administration.
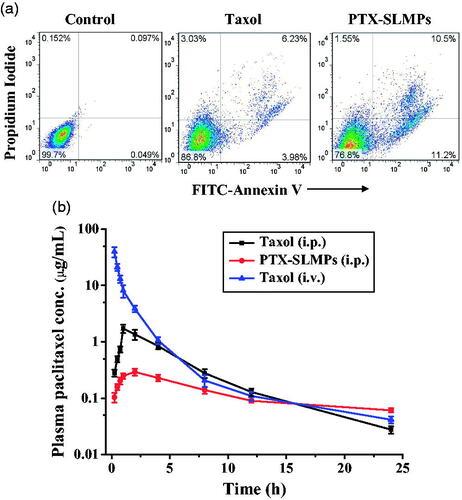
Table 2. Pharmacokinetic study results of taxol® administered by i.v. with taxol® and PTX-SLMPs after i.p. administration at the dose of 10 mg per kg body weight.