Figures & data
Table 1. Primer sequences used in qRT-PCR.
Figure 1. Characterization of GO and GOQDs. (A) Characterization of GO with (a) laser Micro-Raman Spectrometer (b) FTIR spectrometer. (B) Morphology of (a) GO (b) GOQDs with TEM.
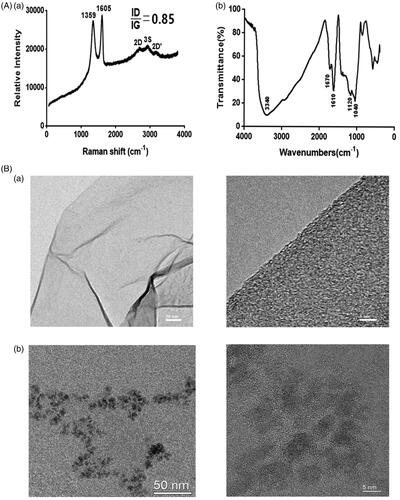
Figure 2. Characterization of SHEDs. (A) (a) 4 days of primary SHEDs (b) 3 days of SHEDs at P3, ×50. (B) Flow cytometry analysis of cell surface marker CD34, CD45, CD44, CD73, CD90, CD105. (C) (a) Cells were treated with osteogenic induction medium after 14 days and stained with Alizarin red, ×50. (b) Cells were treated with adipogenic induction medium after 21 days and stained with oil red O, ×50.
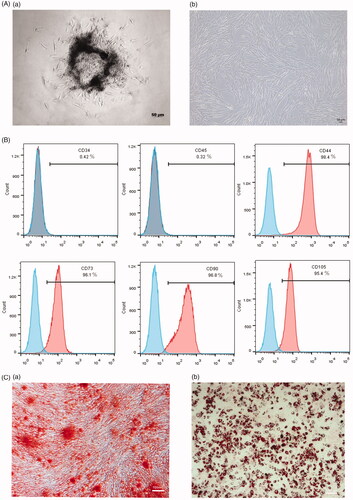
Figure 3. The proliferation of SHEDs incubated with different concentrations (1 and 10 ug/mL) of GO and GOQDs after 1, 3, 5, 7 days. *p < .05.
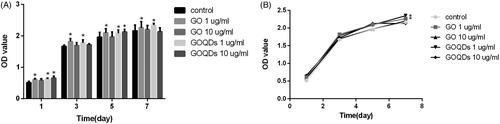
Figure 4. Confocal laser scanning microscopy images of SHEDs incubated with 1 ug/mL of GO and GOQDs, respectively for 48 h.
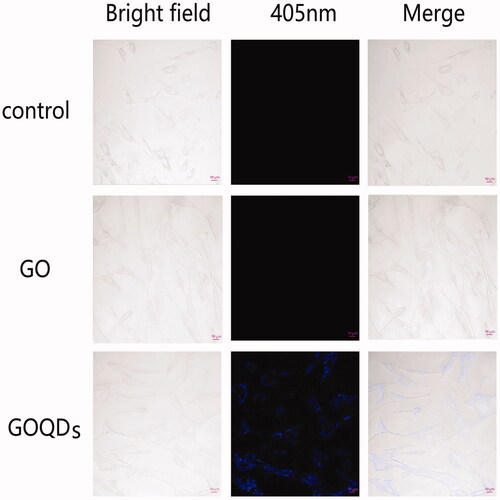
Figure 5. SHEDs were cultured in osteogenic induction medium containing GO or GOQDs. (A) Osteogenic differentiation was detected by ALP activity assay kit after 3 and 7 days. (B) Osteogenic differentiation was detected by Alizarin red S staining for 14 days. (a) Optical images (b) Microscopic images, ×50. *p < .05, **p < .01, ***p < .001, ****p < .0001.
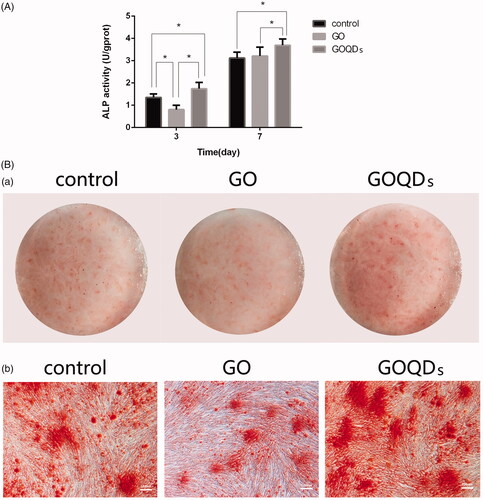
Figure 6. SHEDs were cultured in osteogenic induction medium containing GO or GOQDs. (A) RNA was extracted at 7 days. (B) RNA was extracted at 14 days. *p < .05, **p < .01, ***p < .001, ****p < .001.
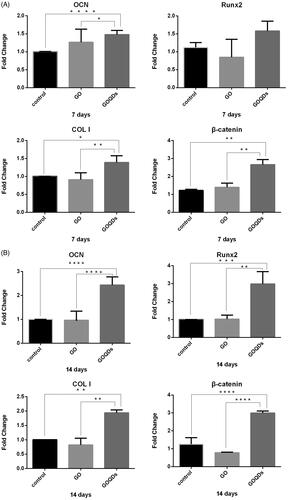
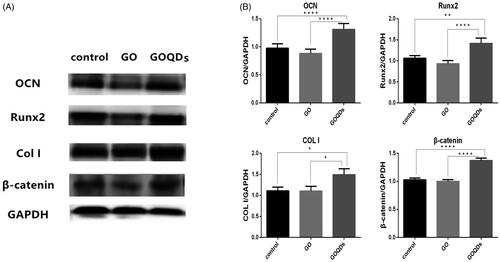
Figure 7. SHEDs were cultured in osteogenic induction medium containing GO or GOQDs for 14 days. (A) Western blot analysis of OCN, Runx 2, COL I, β-catenin and GAPDH expression. (B) Quantification of OCN, Runx 2, COL I and β-catenin protein level. *p < .05, **p < .01, ***p < .001, ****p < .001.