Figures & data
Figure 1. Down-regulation of plastin 3 (PLS3) alone fails to impair proliferation but slightly inhibits apoptosis. (A) The cell survival rate was determined by sulforhodamine B assay, and cells were transfected with Ncontrol or si-PLS3 for 24, 48 and 72 h. The relative absorbance was normalized to the value at 24 h. The histogram plots presented no significant differences in cells transfected with si-PLS3 versus Ncontrol. N.S.: No significance. (B) Representative dot plots showing apoptosis in cells transfected with Ncontrol or si-PLS3 for 48 h. Apoptotic cells were stained with Annexin V-APC/PI and then analyzed by flow cytometry. (C) Quantification of the Q3 population and histogram plots showing a significant decrease in apoptosis upon PLS3 down-regulation. The analysis was carried out using FlowJo 10.0 software. **p < .01 versus Ncontrol. All the data represent the means ± SD of three independent experiments.
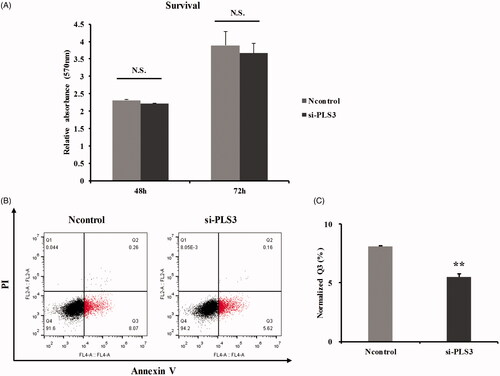
Figure 2. Down-regulation of plastin 3 (PLS3) augments the cell’s sensitivity to paclitaxel (PTX) and Abraxane (ABR). The cell survival rate was determined by sulforhodamine B assay, and cells were treated with the indicated doses of PTX (A) or ABR (B) for 48 h. (C) Representative dot plots showing apoptosis in cells treated with 6 nM PTX or ABR after incubation for 6 h. Apoptotic cells were stained with Annexin V-APC/PI and then analyzed by flow cytometry. (D) Quantification of the Q3 population and histogram plots showing an increase in apoptosis upon PLS3 down-regulation. The analysis was carried out using FlowJo 10.0 software. ***p < .001, **p < .01, *p < .05. All the data represent the means ± SD of three independent experiments.
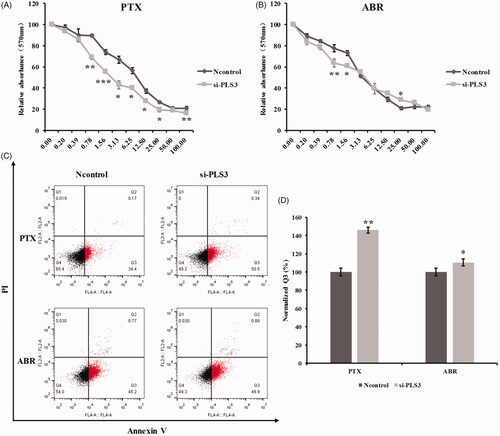
Table 1. IC50 Values in plastin 3 (PLS3)-down-regulated and control MDA-MB-231 cells treated with paclitaxel (PTX) and abraxane (ABR).
Figure 3. Down-regulation of plastin 3 (PLS3) activates the p38 MAPK signalling pathway with exposure to paclitaxel (PTX) but not with Abraxane (ABR). (A) The expression of PLS3, p-p38 MAPK, t-p38 MAPK, p53, MDM-2, and Bcl-2 in MDA-MB-231 cells treated with 6 nM PTX or ABR for 24 h was detected by Western blotting. MDA-MB-231 cells were transfected with Ncontrol or si-PLS3 for 48 h before treatment. β-Actin was used as a loading control. (B) Histogram plots representing the ratio of p-p38/t-p38. The expression of p-p38 and t-p38 was analyzed using ImageJ software. (C) Relative expression levels of PLS3, p53, MDM-2, and Bcl-2, normalized to the expression of β-actin. The PLS3, p53, MDM-2, and Bcl-2 expression values were analyzed using ImageJ software. *p < .05. All the data represent the means ± SD of three independent experiments.
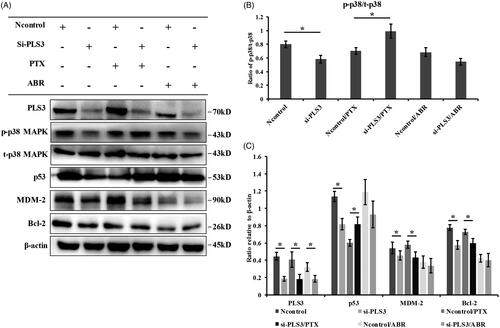
Figure 4. The increased cell sensitivity to paclitaxel (PTX) triggered by plastin 3 (PLS3) down-regulation is dependent on the p38 MAPK signalling pathway. (A) Representative dot plots showing apoptosis in cells treated with DMSO or 10 μM SB203580 or 6 nM PTX or both after incubation for 6 h. Apoptotic cells were stained with Annexin V-APC/PI and then analyzed by flow cytometry. (B) Quantification of the Q3 population and histogram plots showing a decrease in apoptosis upon exposure to SB203580 and PTX, compared with PTX alone in si-PLS3 groups. The analysis was carried out using FlowJo 10.0 software. (C) The expression of PLS3, p53, MDM-2, and Bcl-2 in MDA-MB-231 cells treated with either DMSO, 10 μM SB203580 or 6 nM PTX or both for 24 h was detected by Western blotting. The MDA-MB-231 cells were transfected with Ncontrol or si-PLS3 for 48 h before treatment. β-Actin was used as a loading control. (D) Relative expression levels of PLS3, p53, MDM-2, and Bcl-2, normalized to the expression of β-actin. The PLS3, p53, MDM-2, and Bcl-2 expression levels were analyzed using ImageJ software. ***p < .001, **p < .01, *p < .05. N.S.: No significance. All the data represent the means ± SD of three independent experiments.
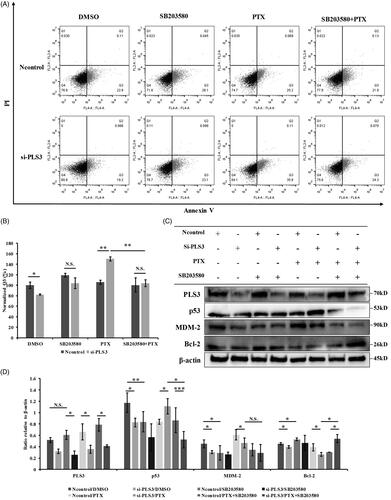
Figure 5. Down-regulation of plastin 3 (PLS3) may decrease the cell’s sensitivity to Abraxane (ABR) via the impairment of endocytosis. (A) Representative dot plots showing FITC-dextran uptake in cells transfected with Ncontrol or si-PLS3 at 30 min, 1 h, and 2 h. (B) Quantification of the Q3 population and histogram plots showing a decrease in FITC-dextran uptake upon PLS3 down-regulation. The analysis was carried out by using FlowJo 10.0 software. ***p < .001, *p < .05 versus Ncontrol. N.S.: No significance. All the data represent the means ± SD of three independent experiments.
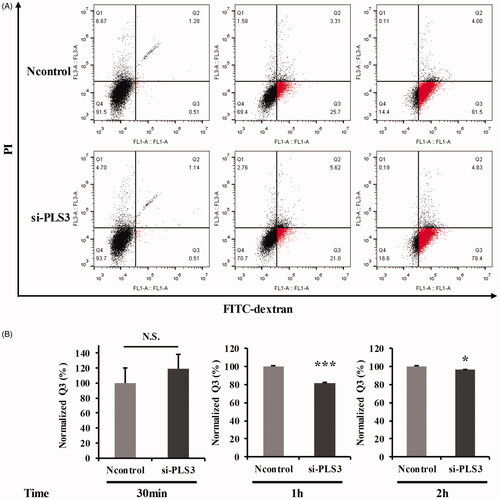
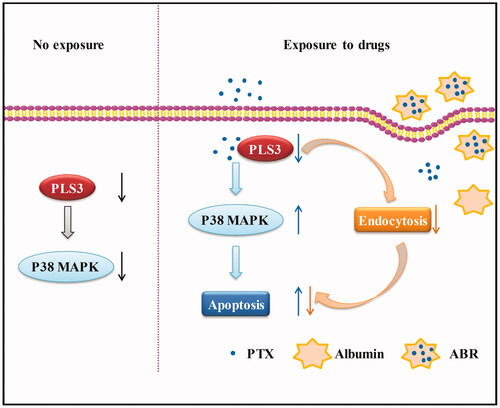
Figure 6. Schematic model presenting the role of plastin 3 (PLS3) in the regulation of apoptosis induced by paclitaxel (PTX) or Abraxane (ABR) in triple-negative breast cancer cells. In cells with no exposure, PLS3 down-regulation inhibits p38 MAPK signalling pathway. In cells exposed to PTX, PLS3 down-regulation augments the sensitivity to PTX by enhancing apoptosis via activation of the p38 MAPK signalling pathway. In PLS3-silenced cells exposed to ABR, impaired endocytosis neutralises the apoptosis induced by the free PTX.