Figures & data
Figure 1. Characterization of CS NPs. (A) TEM images of CS NPs, (B) DLS analysis of CS NPs, (C) zeta potential of CS NPs.
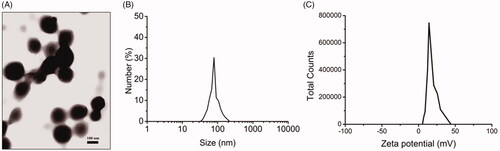
Figure 2. In vitro cellular distribution of CS NPs after incubating SMMC-7721 cells with rhodamine B-labeled CS NPs. (a) Fluorescent image of cells, the scale bar is 100 μm and applies to all parts. (b) Fluorescence spectrum analysis of the uptake of RhoB-labeled CS NPs in SMMC-7721 cells. Results were expressed as means ± SD (n = 3). #p < .05, vs relative fluorescence ratio of NPs at 1 h. (c) Study on uptake mechanisms involved in the cellular entry of NPs. Results were expressed as means ± SD (n = 3). *p < .05, vs RhoB-labeled CS NPs treated with chlorpromazine.
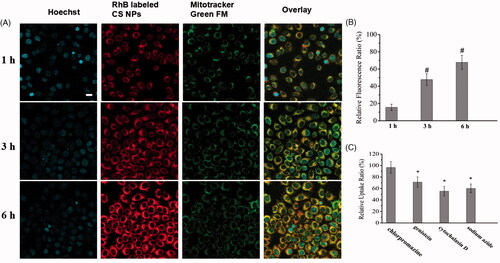
Figure 3. ROS generation in SMMC-7721 cells treated with CS NPs. (A) Image changes of ROS generation following treatment with CS NPs and its combination with NAC and ESI, the scale bar is 50 μm and applies to all parts. (B) Quantification of ROS generation in cells treated with CS NPs and its combination with NAC and ESI at different times. Data are presented as means ± SD (n = 3). +p < .05 vs CS NPs group at 12 h, *p < .05 vs CS NPs group at 24 h, #p < .05 vs CS NPs group at 48 h.
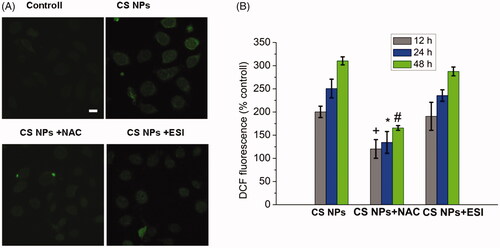
Figure 4. ER stress in SMMC-7721 cells treated with NPs, ER staining with the ER Tracker blue–white DPX probe. (A) Image changes of ER stress following treatment with CS NPs and its combination with NAC and ESI, the scale bar is 100 μm and applies to all parts. (B) Quantification of ER stress in cells treated with CS NPs and its combination with NAC and ESI at different time. Data are presented as means ± SD (n = 3). +p < .05 vs CS NPs group at 12 h, *p < .05 vs CS NPs group at 24 h, #p < .05 vs CS NPs group at 48 h.
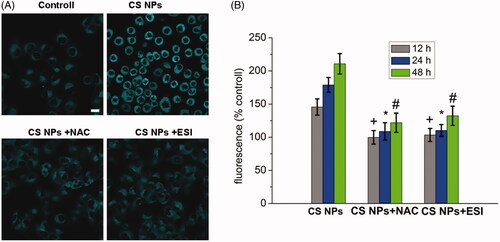
Figure 5. Changes in the mitochondrial membrane potential after incubating CS NPs and its combination with NAC and ESI with SMMC-7721 cells. (A) Image analysis of mitochondrial membrane potential of SMMC-7721 cells treated with CS NPs and its combination with NAC and ESI. The scale bar is 50 μm and applies to all parts. (B) Quantification of red/green fluorescence intensity ratio by Image J. Data are presented as means ± SD (n = 3). *p < .05 vs control group.
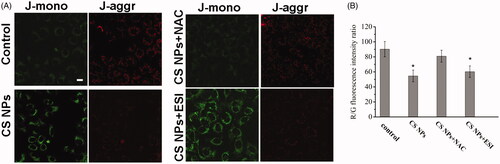
Figure 6. Viability of SMMC-7721 cells after incubation with CS NPs and its combination with NAC and ESI for 12 h. Data are presented as mean ± SD (n = 3).
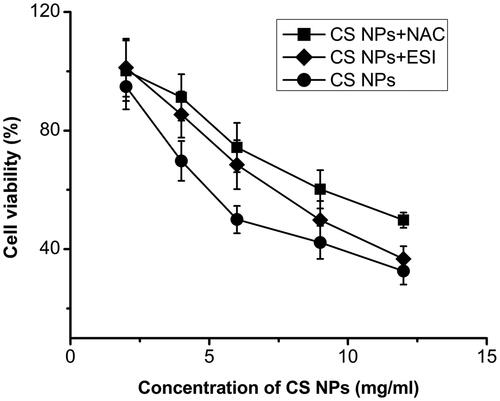
Figure 7. The cell cycle profiles of SMMC-7721 cell treated with CS NPs and its combination with NAC and ESI for 12 h using flow cytometry.
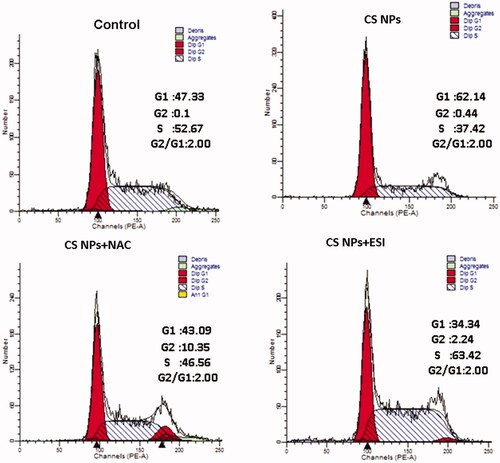
Figure 8. Apoptosis of SMMC-7721 cells treated with CS NPs and its combination with NAC and ESI for 12 h determined by Annexin V–fluorescein isothiocyanate/propidium iodide staining.
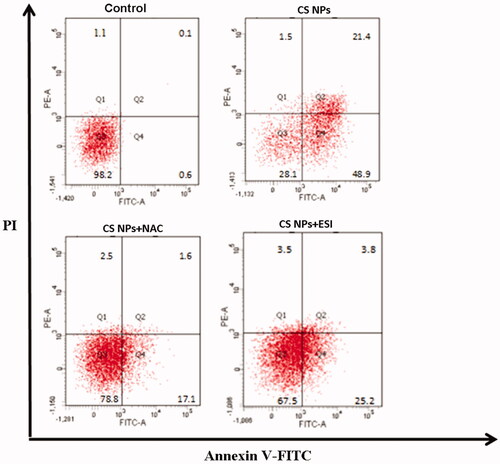
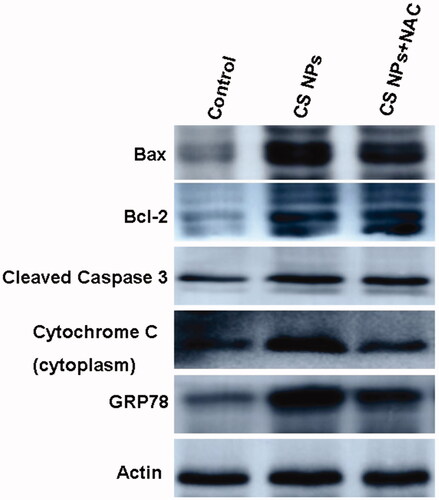
Figure 9. Western blot analyses of the expression levels of Cleaved caspase-3, Bcl-2, Bax, GRP78 and cytochrome c in SMMC-7721 cells treated with CS NPs and its combination with NAC for 12 h.