Figures & data
Figure 1. HPLC analysis of IOP. IOP was applied to a C18 chromatographic column (250 × 4.6 mm, 5 μm); flow rate was 1.0 ml/min; mobile phase: regent A was 50 mmol/l of phosphate buffer (KH2PO4–NaOH, pH = 6.9), regent B was CH3CN; detection wavelength was 250 nm and the flow rate was 1.0 ml/min.
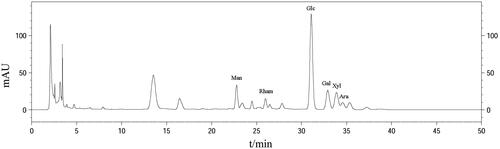
Figure 2. IOP ameliorated DSS-induced colitis in mice. Colitis were induced by orally giving DSS (3%), in the first two cycles, mice were given DSS (3%) for five days and followed by water for 14 days, and the third cycle, mice were just given DSS (3%) for five days, modelling 43 days in total. (a) Body weight loss. (b) Rectal bleeding in mice. (c) DAI score of mice. (d,e) Colon length of each group. *p < .05, **p < .01 compared with model group; #p < .05, ##p < .01 compared with control group.
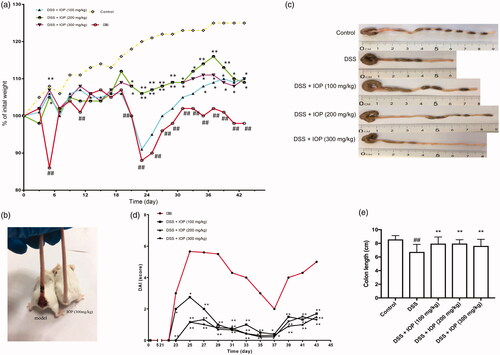
Figure 3. IOP alleviates colon tissue injury caused by DSS and restores the loss of tight junction (TJ) proteins. Colitis was induced by orally giving DSS (3%), in the first two cycles, mice were given DSS (3%) for five days and followed by water for 14 days, and the third cycle, mice were just given DSS (3%) for five days, modelling 43 days in total. (a) Histopathological changes and inflammation of colon. (b) Histopathological score. (c) ZO-1 expression in colon tissue was examined with immunohistochemical staining. (d,e) ZO-1 expression in colon tissue detected with western blot. (f) Occludin expression in colon tissue tested with immunohistochemical staining. (g,h) Occludin expression in colon tissue examined by western blot. Microphotographs were taken at ×20 magnification; bars = 50 µm. *p < .05, **p < .01 compared with model group; #p < .05, ##p < .01 compared with control group.
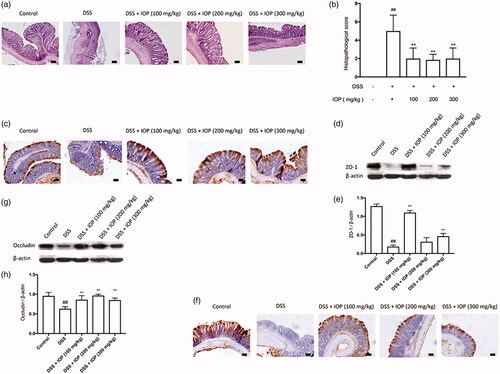
Figure 4. IOP regulated mRNA levels of Th1-, Th2-, Th17-, Treg-related cytokines and transcription factors in colon tissue. (a) Related cytokines and transcription factors mRNA expression. (b,f) Statistics of Th1-related IFN-γ and transcription T-bet. (c,g) Statistics of Th2-related IL-4 and transcription factors GATA-3. (d,h) Statistics of Th17-related IL-17 and transcription factor ROR-γt. (e,i) Statistics of Treg-related IL-10 and transcription factor Foxp3. *p < .05, **p < .01 compared with model group; #p < .05, #p < .01 compared with control group.
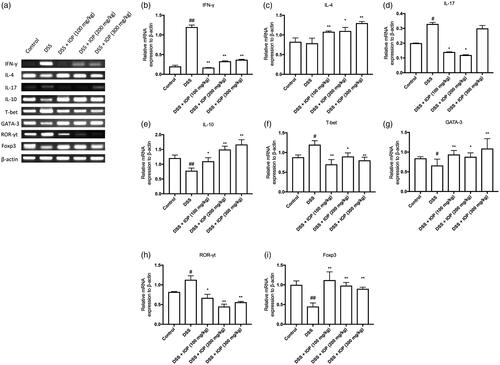
Figure 5. Effect of IOP on Th1, Th2, Th17, Treg differentiation in spleen and MLN examined with flow cytometry. (a–c) The effect of IOP on differentiation ratio of IFN-γ+T cells (Th1). (d–f) Effect of IOP on differentiation ratio of IL-4+T cells (Th2). (g–i) Effect of IOP on differentiation ratio of IL-17+T cells (Th17). (j–l) Effect of IOP on differentiation ratio of Foxp3+T cells (Treg). *p < .05, **p < .01 compared with model group; #p < .05, ##p < .01 compared with control group.
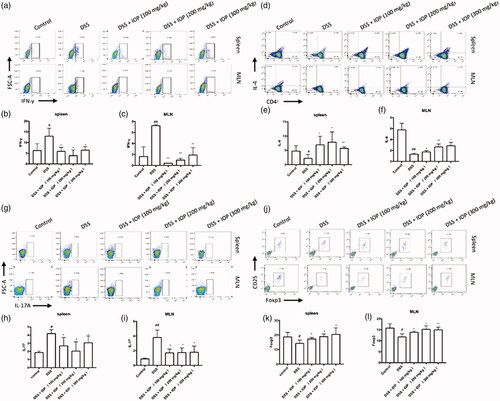
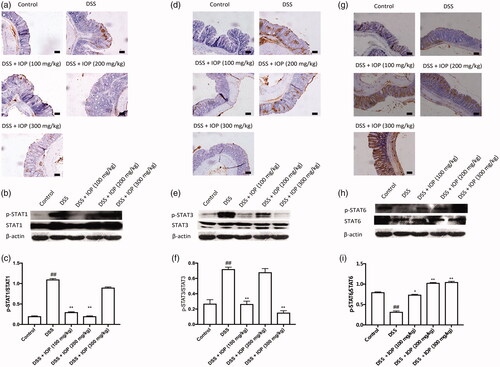
Figure 6. Effect of IOP on the activation JAK-STAT signalling pathway in colon tissue examined with immunohistochemical and western blot. (a–c) STAT1 and p-STAT1 expression in colon tissue. (d–f) STAT3 and p-STAT3 activation of colon tissue. (g–i) STAT6 and p-STAT6 activation of colon tissue. *p < .05, **p < .01 compared with model group; microphotographs were taken at ×20 magnification; bars = 50 µm. #p < .05, #p < .01 compared with control group.