Figures & data
Figure 1. Increased SBF2-AS1 expression in CC. (A–C) SBF2-AS1 expression in CC tissues and ANT tissues was analyzed according to GEPIA database. (D,E) SBF2-AS1 expression in CC tissues and cell lines was determined by qRT-PCR. (F,G) High SBF2-AS1 expression was associated with advanced FIGO stage and lymph node metastasis of CC patients. *p < .05. CESC: cervical squamous cell carcinoma and endocervical adenocarcinoma.
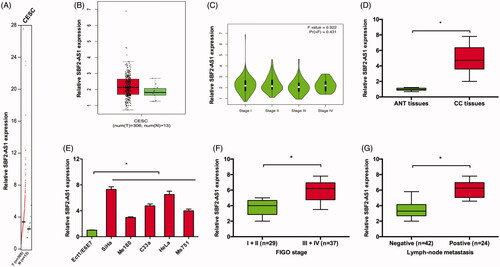
Figure 2. SBF2-AS1 inhibition reduced CC growth both in vitro and in vivo. (A) si-SBF2-AS1 transfection led to SBF2-AS1 inhibition in SiHa and HeLa cells. (B,C) CCK-8 and colony formation assays showed that SBF2-AS1 suppression inhibited CC cells viability. (D,E) Flow cytometry assay showed that SBF2-AS1 silencing arrested CC cells in G0/G1 phase and induced cell apoptosis. (F,G) The xenograft tumor volume and weight in the SBF2-AS1 inhibition group were significantly suppressed. (H) qRT-PCR was used to determine SBF2-AS1, miR-361-5p and FOXM1 expression in xenograft tumor. (I) Western blot showed SBF2-AS1 inhibition decreased FOXM1 protein expression in xenograft tumor. *p < .05.
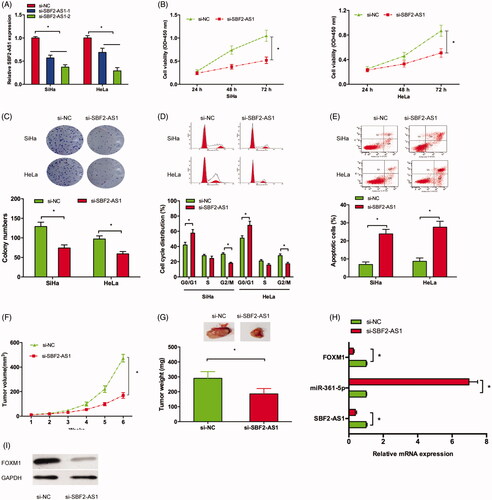
Figure 3. SBF2-AS1 acted as a sponge for miR-361-5p. (A) Potential binding site for miR-361-5p in SBF2-AS1. (B,C) miR-361-5p expression in CC tissues and cell lines was determined by qRT-PCR. (D) Correlation between SBF2-AS1 expression and miR-361-5p expression in CC tissues. (E) Luciferase reporter assay revealed that miR-361-5p mimics significantly reduced the luciferase activity of SBF2-AS1-Wt reporter in CC cells. (F) SBF2-AS1 inhibition increased miR-361-5p expression in SiHa and HeLa cells (G) RIP assay showed that SBF2-AS1 and miR-361-5p expression was significantly enriched in Ago2 pellet compared to IgG control. *p < .05.
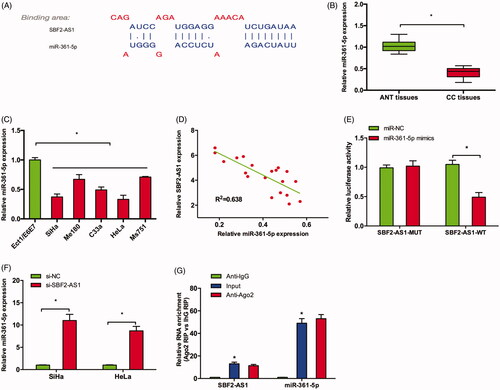
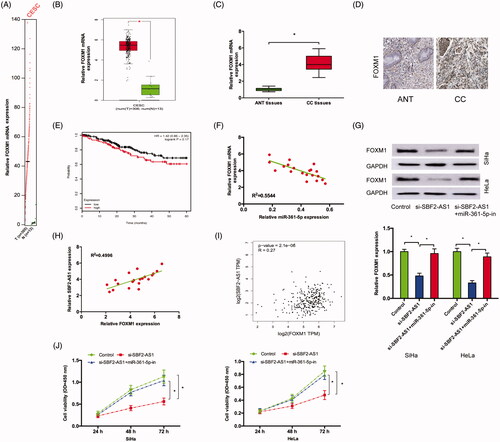
Figure 4. SBF2-AS1 regulated FOXM1 expression via miR-361-5p. (A,B) FOXM1 expression in CC tissues and ANT tissues was analyzed by GEPIA. (C,D) FOXM1 expression in CC tissues was determined by qRT-PCR and IHC. (E) Kaplan–Meier plotter analysis showed that high FOXM1 expression was associated with poor overall survival of CC patients. (F) Correlation between miR-361-5p expression and FOXM1 expression in CC tissues. (G) miR-361-5p inhibitors reversed the effects of SBF2-AS1 silencing on FOXM1 expression in protein levels. (H,I) Correlation between SBF2-AS1 expression and FOXM1 expression in CC tissues. (J) CCK-8 assay showed that miR-361-5p inhibitors significantly rescued the proliferation of SBF2-AS1 silenced CC cells. *p < .05.