Figures & data
Figure 1. SEM surface morphology of PMMA particles at two magnifications, 20,000× (a) and 50,000× (b). The particles show uniform morphology with spherical shape and a narrow size distribution.
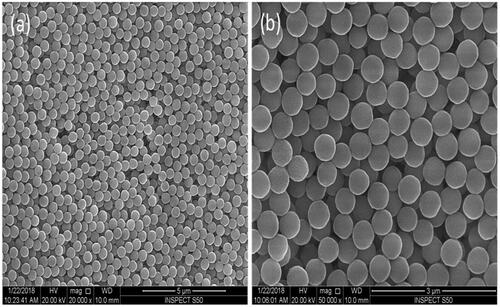
Figure 2. Morphology and size analysis of the polymethyl methacrylate (PMMA) nanoparticles. (a,b) TEM images at two different magnifications displaying the spherical nature of the particles. The particles show a narrow size distribution. (c) Intensity profile extracted from the selected nanoparticles as highlighted by green line in the image. The diameter of the particles is around 480 nm. (d) Size histogram of the PMMA particles showing the size distribution, more than 50 particles were measured for this analysis using Gatan digital micrograph software. The average diameter of the nanoparticles was estimated around 470 ± 4 nm.
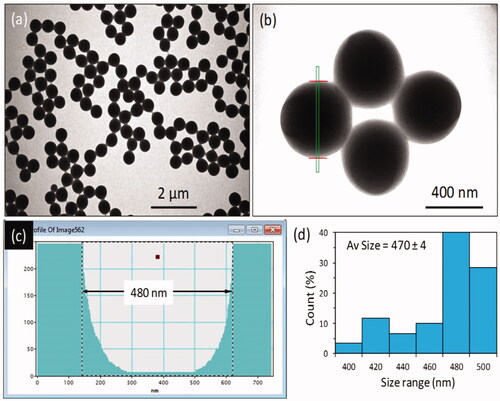
Figure 3. Hydrodynamic size distribution of the prepared PMMA latex particles. The hydrodynamic size deduced from Stokes-Einstein equation was found to be 606 nm with narrow size distribution.
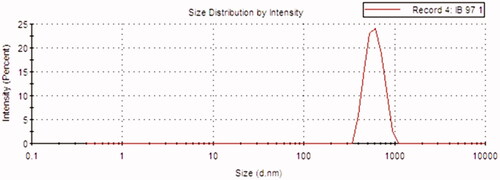
Figure 4. Cell Morphology of HEK-293 and HCT-116 cells after 24 h of treatment of PMMA: (a) control, (b) 5.0 μg/mL and (c) 7.5 μg/mL of HEK-293 cells. (d) Control, (e) 5.0 μg/mL and (f) 7.5 μg/mL of HEK-293 cells. Nuclear condensation (arrows) (400× magnifications).
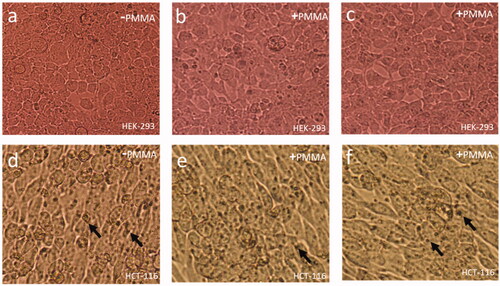
Figure 5. Cell Morphology of HEK-293 and HCT-116 cells after 48 h of treatment of PMMA: (a) control, (b) 5.0 μg/mL and (c) 7.5 μg/mL of HEK-293 cells. (d) Control, (e) 5.0 μg/mL and (f) 7.5 μg/mL of HEK-293 cells. Nuclear condensation (arrows). (400× magnifications).
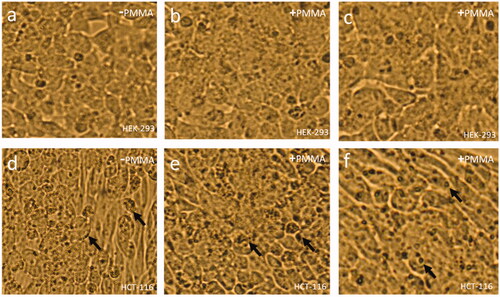
Figure 6. Cell viability analysis. HCT-116 cells were treated with PMMA (1 μg/mL, 2.5 μg/mL, 5.0 μg/mL and 7.5 μg/mL) for 48 h and then processed for MTT analysis. Data are the means ± SD of three different experiments. Difference between two treatment groups was analysed by Student’s t test where (*p < .05), p values were calculated by Student’s t test.
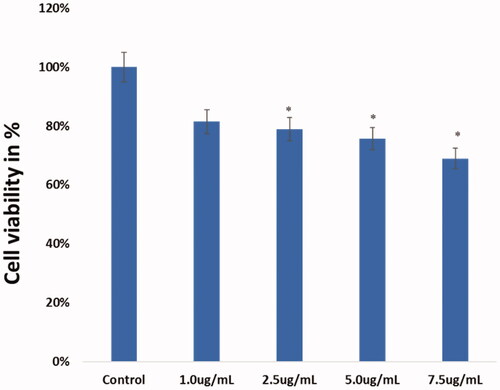
Figure 7. Cell viability analysis: PMMA (1 μg/mL, 2.5 μg/mL, 5.0 μg/mL and 7.5 μg/mL) were treated to HCT-116 and HEK-293 cells for 48 h and processed for MTT assay. Data are the means ± SD of three different experiments. Difference between two treatment groups was analysed by Student’s t test where (*p < .05), p values were calculated by Student’s t test.
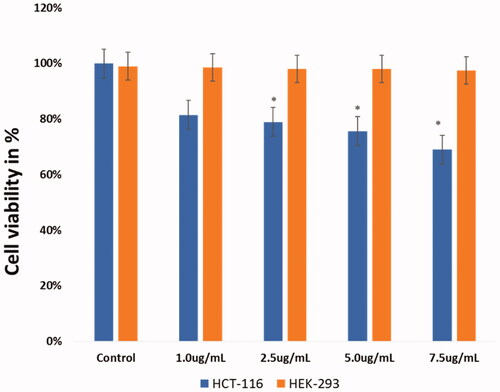
Figure 8. Effect of PMMA on wound healing. Wound healing assays of PMMA was performed in HCT-116 cells. These are representative photographs of (a) non-treated HCT-116 with scratch 0 h, (b) non-treated HCT-116 cells after 24 h, (c) PMMA-treated cells (7.5 μg/mL) 0 h and (d) PMMA-treated cells (7.5 μg/mL) 24 h. Figure (b) shows healing of cells after 24 h, whereas (d) shows no-healing after 24 h. 400× magnifications.
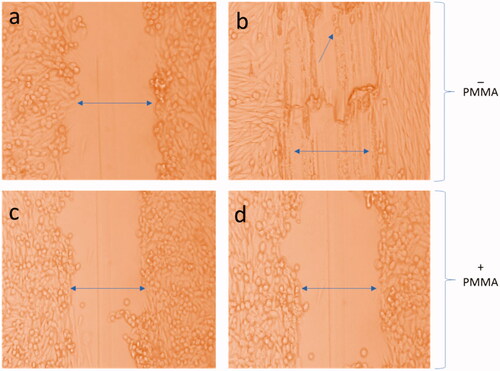
Figure 9. (a–d) Confocal microscopic images of HEK-293 and HCT-116 cells stained with DAPI: Figures (a) and (c) are control cells (without PMMA treatment), whereas (b) and (d) treated with PMMA (7.5 μg/mL) for 48 h. There is no cell death in PMMA-treated HEK-293 cells (d), whereas there is a significant loss of HCT-116 cells treated with PMMA when compared with control cells. 200× magnifications.
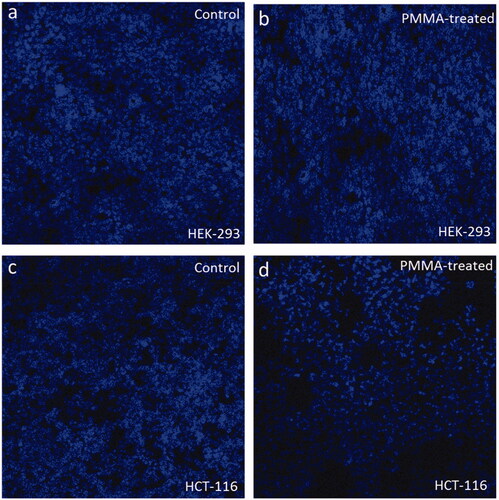
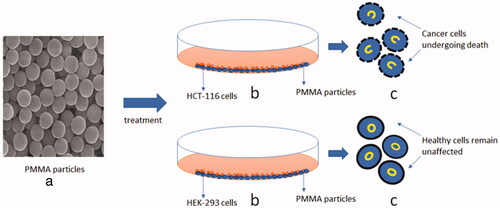
Figure 10. (a–c) Schematic representation of treatment of PMMA particles on cancer cells: (a) structure of PMMA particles through scanning electron microscope with 50,000× magnification, (b) treatment of PMMA particles with HCT-116 and HEK-293 cells in the Petri dishes and (c) showing PMMA-treated HCT-116 cancer cells undergoing membrane disruption, and nuclear condensation and augmentation, whereas PMMA-treated HEK-293 cells remain unaffected.