Figures & data
Table 1. The primer sequences of target genes.
Table 2. Experimental groups with vaccine formulations.
Figure 1. FTIR spectra MNP nanoparticles (a), MNP–silica-coated nanoparticles (b), LCMNP (c), MLCMNP (d), l-cysteine (e) and mannose (f).
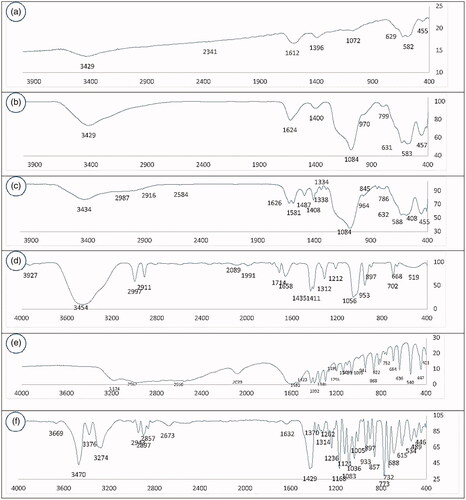
Figure 2. XRD patterns of LCMNP and MLCMNP.
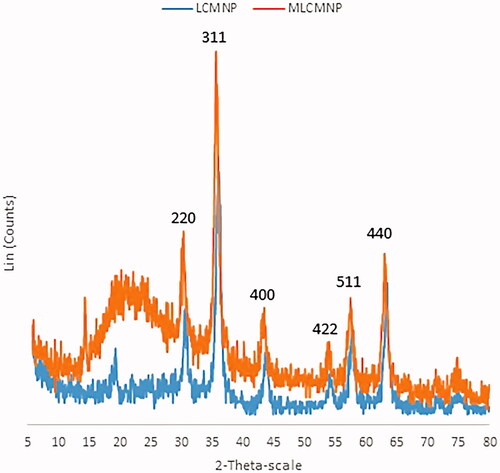
Figure 3. SEM images of (a) LCMNP, (b) MLCMNP and (c) MLCMNP-rHBsAg.
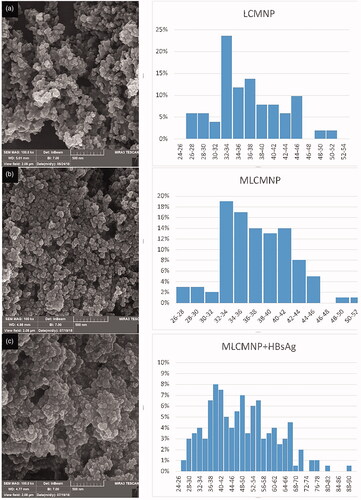
Table 3. Nanoparticles characterization.
Figure 4. HBsAg release profile from LCMNP/MLCMNP. The values are expressed as mean ± SD (n = 3).
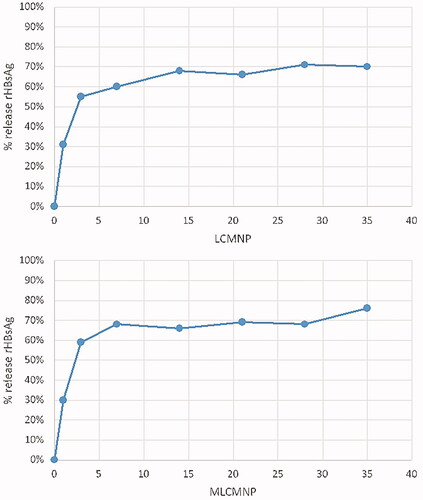
Figure 5. (A) 5 µg/lane HBsAg; (B) 10 µg/lane HBsAg; (C) 20 µg/lane HBsAg; (D) markers; (E) MNP + HBsAg + mannose precipitate; (F) MNP + HBsAg + mannose supernatant; (G) MNP + HBsAg precipitate; (H) MNP + HBsAg supernatant.
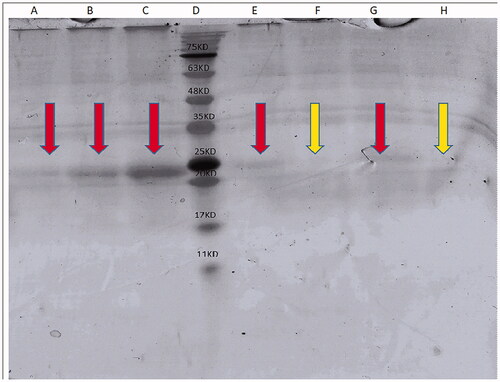
Figure 6. MTT assay against HEK293 cells with different concentrations of HBsAg-loaded MLCMNP (a) and LCMNP (b) nanoparticles. Data are shown as mean ± SD (n = 3).
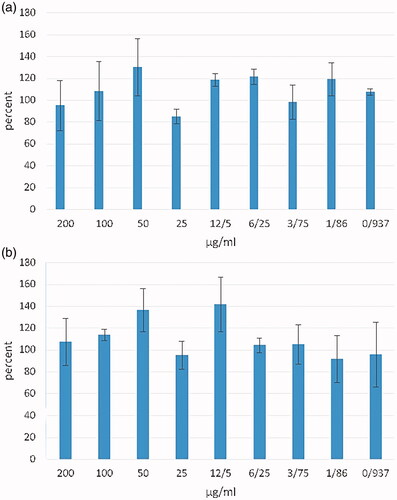
Figure 7. ICP-OES analysis of the iron contents of the J774 cells incubated with 200 μg/mL of MNP, MNP + mannose, MNP + HBsAg, MNP + mannose + HBsAg and also mere cells was used as a control.
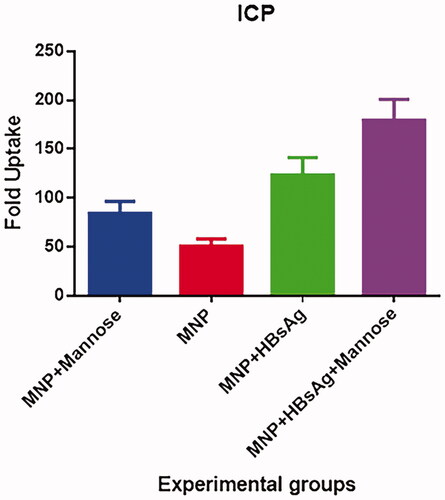
Figure 8. Real-time-PCR quantification of IFN-γ, TNF-α, TGF-β, IL-10 and IL-6 cytokine gene expressions in macrophage/dendritic cells MNP (A), MNP + mannose-stimulated cells (B), MNP + HBsAg-stimulated cells (C), MNP + HBsAg + mannose-stimulated cells (D), and LPS-stimulated cells compared with β-actin gene (E). Expression was monitored over a 12-h period.
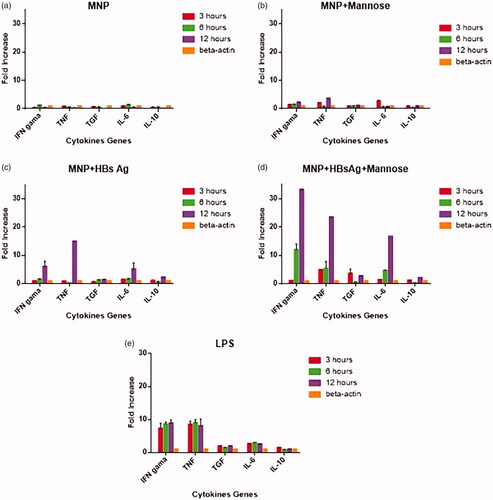
Figure 9. Specific total IgG responses after immunization course. Conjugation of nano-vaccine with mannose increased antibody responses versus nano-vaccine without mannose.
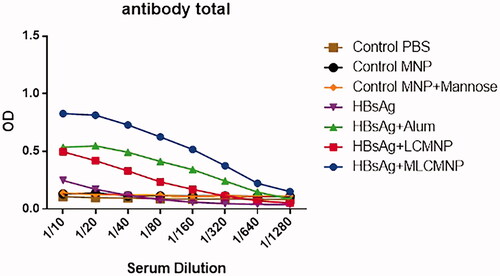
Figure 10. Results of IgG2a/IgG1 isotype. The sera 7 days after the last immunization. Conjugation of nano-vaccine with mannose increased IgG2a/IgG1 ratio versus nano-vaccine without mannose. Data are shown as mean ± SD.
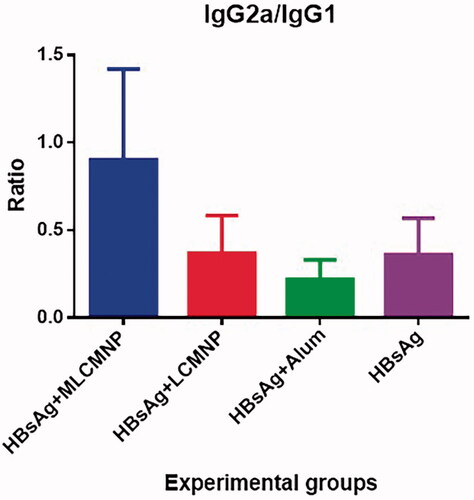
Figure 11. Results of lymphocyte proliferation. Experimental mice were immunized with MLCMNP-HBsAg, LCMNP-HBsAg, commercial vaccine, HBs Ag alone and control mice were injected with MNP, MNP + mannose and PBS. Two weeks after last immunization, lymphocyte proliferation was assessed with BrdU method as mentioned in the method section. The results presented as mean ± SD of 10 mice per group. Immunization with MLCMNP-HBsAg and LCMNP-HBsAg significantly increased lymphocyte proliferation versus commercial vaccine, HBs Ag alone and control groups.
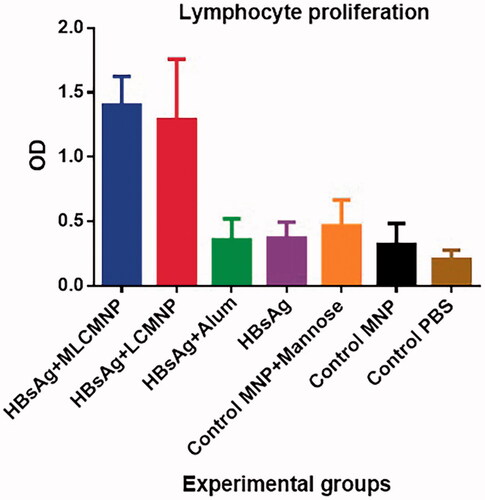
Figure 12. Results of IFN-γ cytokine assay. Mice were immunized two times with two weeks’ interval with MLCMNP-HBsAg, LCMNP-HBsAg formulation, commercial vaccine and HBs Ag alone along with proper control groups. Two weeks after last immunization of experimental mice, IFN-γ cytokine level was assessed using commercial quantitative ELISA kit. The results presented as mean ± SD of ten mice per group. Immunization with MLCMNP-HBsAg, LCMNP-HBsAg formulation, commercial vaccine and HBs Ag alone significantly increased IFN-γ cytokine versus control groups.
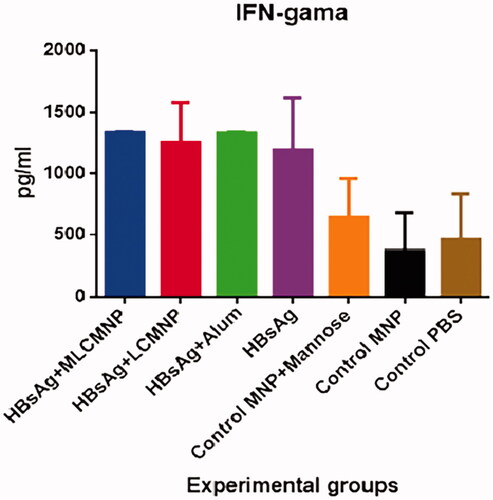
Figure 13. Results of TNF-α cytokine assay. Data presented as mean ± SD of 10 mice per group. Immunization with MLCMNP-HBsAg significantly increased TNF-α cytokine versus the LCMNP-HBsAg group.
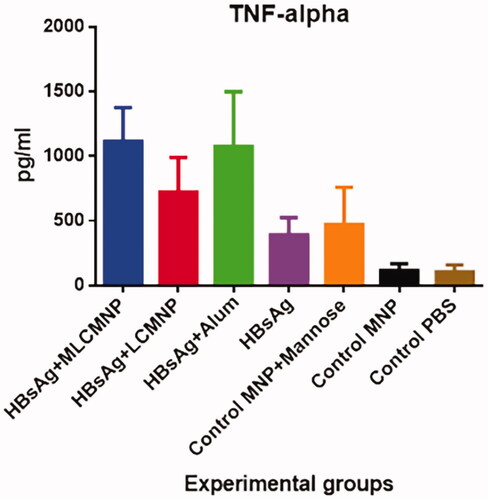
Figure 14. Results of IL-2 cytokine assay. After immunization course of experimental mice, IL-2 cytokine level was assessed with a quantitative commercial ELISA kit. Immunization of mice by MLCMNP-HBsAg formulation shows a significant increase of IL-2 cytokine production versus other experimental groups.
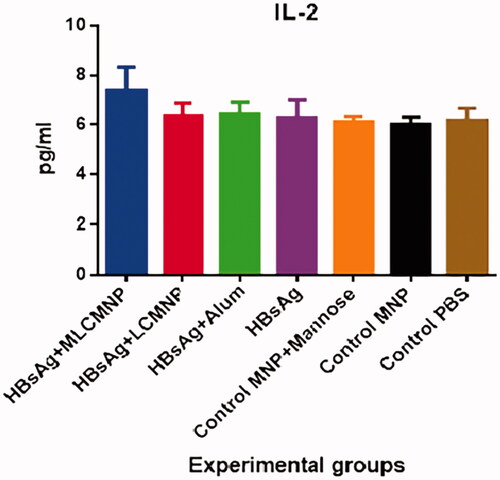
Figure 15. Results of IL-4 cytokine assay. After immunization course of experimental mice, IL-4 cytokine level was assessed with a quantitative commercial ELISA kit. The results presented as mean ± SD of 10 mice per group. Immunization with MLCMNP-HBsAg, LCMNP-HBsAg formulation significantly increased IL-4 cytokine secretion versus commercial vaccine, HBs Ag alone and control groups.
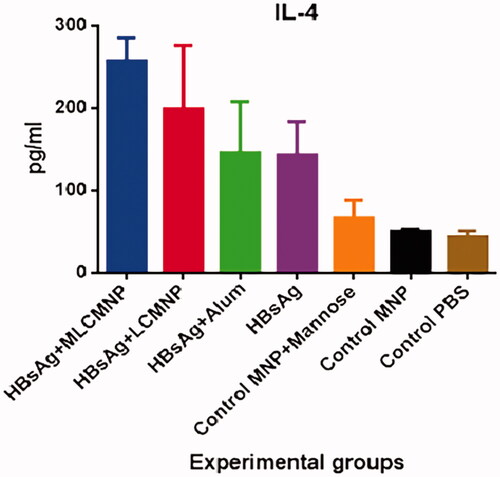
Figure 16. Results of IL-12 cytokine assay. The results presented as mean ± SD of 10 mice per group. Immunization of mice with MLCMNP-HBsAg formulation represented a significant increase in IL-12 level versus other experimental groups.
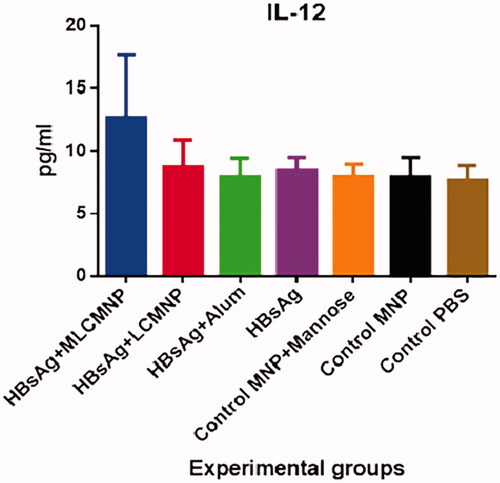
Figure 17. Interaction between LCMNP and mannose sugar.
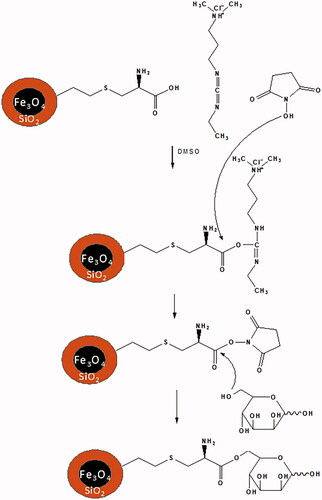
Table 4. X-ray photoelectron spectroscopy (XPS) analysis of atomic percentages of elements present on LCMNP, MLCMNP, MLCMNP-HBsAg and LCMNP-HBsAg.
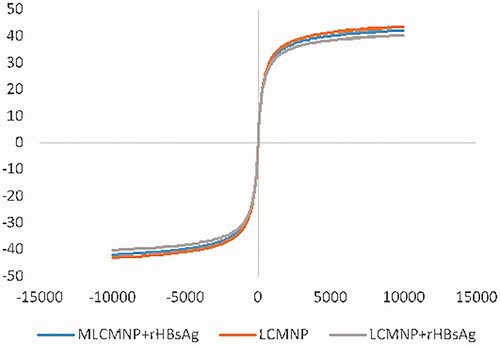
Figure 18. Magnetization curves for the prepared LCMNP, MLCMNP-HBsAg and LCMNP-HBsAg.