Figures & data
Figure 1. TEM micrographs of ZnO NPs-FA, showing isolated particles with a mean diameter of 2–20 nm.
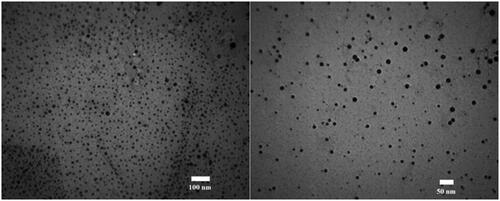
Figure 2. FTIR spectra of folic acid-ZnO nanoparticles. The COOH bands represented the folic acid conjugated with zinc oxide.
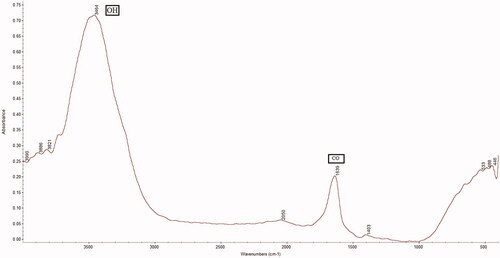
Figure 3. Percentage of viability of treated glioblastoma cells at 12 h (Mean ± SEM); * a significant difference with the control and sham groups simultaneously. ‡ a significant difference with the other concentration groups simultaneously.
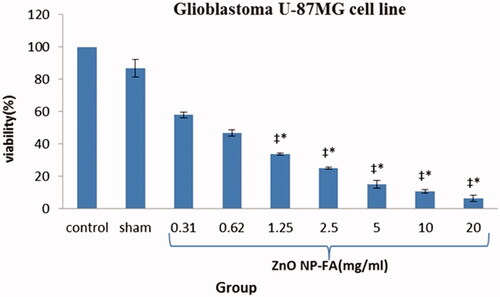
Figure 4. Percentage of viability of treated astrocyte cells after 12 h (Mean ± SEM); * a significant difference with the control and sham groups simultaneously. ‡ a significant difference with the other concentration groups simultaneously.
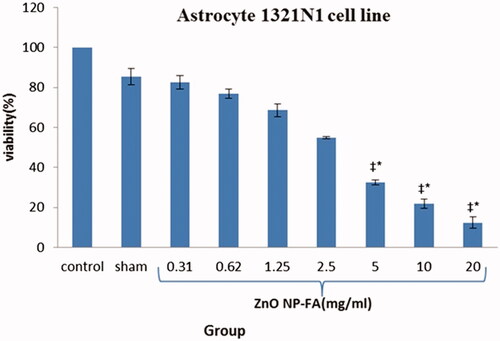
Figure 5. Comparison of different times of glioblastoma cells treated with 1.25 mg/mL after 12, 24 and 48 h (Mean ± SEM); * a significant difference compared to control and sham groups, ‡ a significant difference compared to each group.
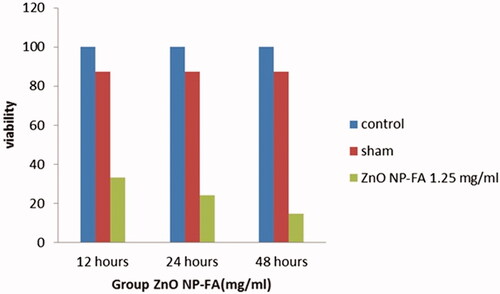
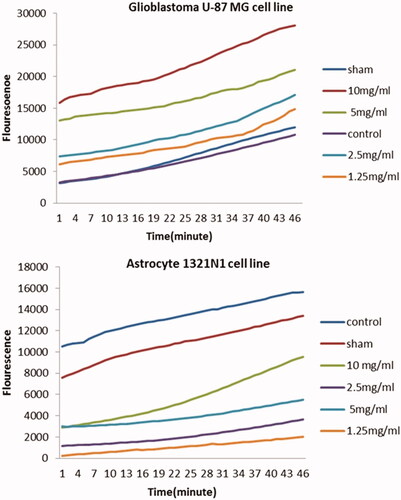
Figure 6. Generation of ROS in glioblastoma U-87MG (a) and astrocyte 1321N1 (b) cell lines treated with different concentrations of folic acid-ZnO NPs after 12 h using the oxidation sensitive dye DCFH-DA.