Figures & data
Figure 1. Flow diagram of article selection process.
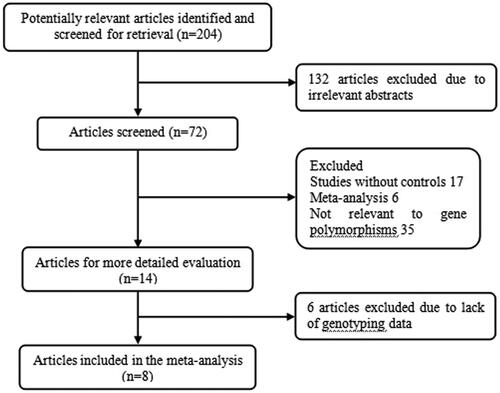
Table 1. Principal characteristics of the studies included in the meta-analysis.
Figure 2. Forest plot of RA susceptibility associated with IL-23R gene rs2201841 polymorphism under the G vs. A model. The squares and horizontal lines correspond to the study-specific OR and 95% CI. The area of the squares reflects the weight (inverse of the variance). The diamond represents the summary OR and 95% CI.
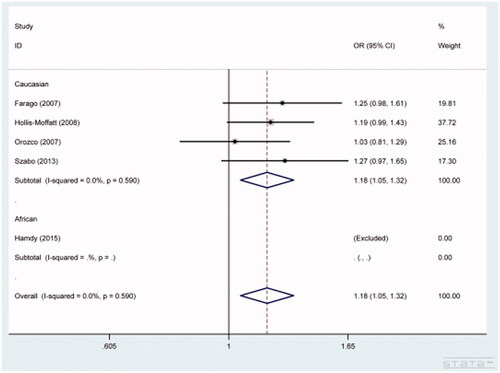
Table 2. IL-23R Gene polymorphisms and RA susceptibility.
Figure 3. Sensitivity analysis for IL-23R gene rs2201841 polymorphism under the allele A vs. allele G model.
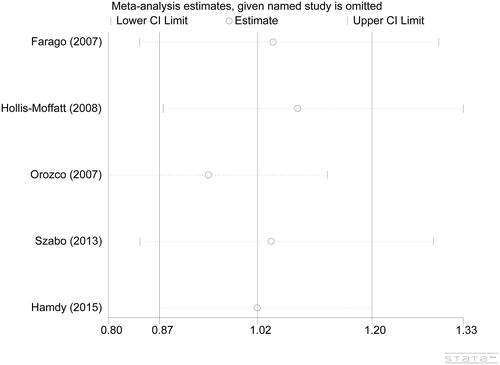
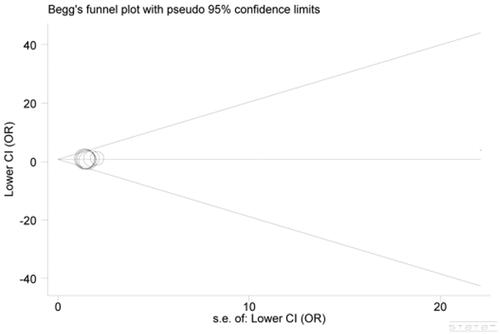
Figure 4. Begg’s funnel plot for publication bias. Each point represents a separate study for the indicated association. Log(OR): natural logarithm of OR; Horizontal line: mean effect size.